 Plan · Service Metrics
One number for everyone who worshiped with you.
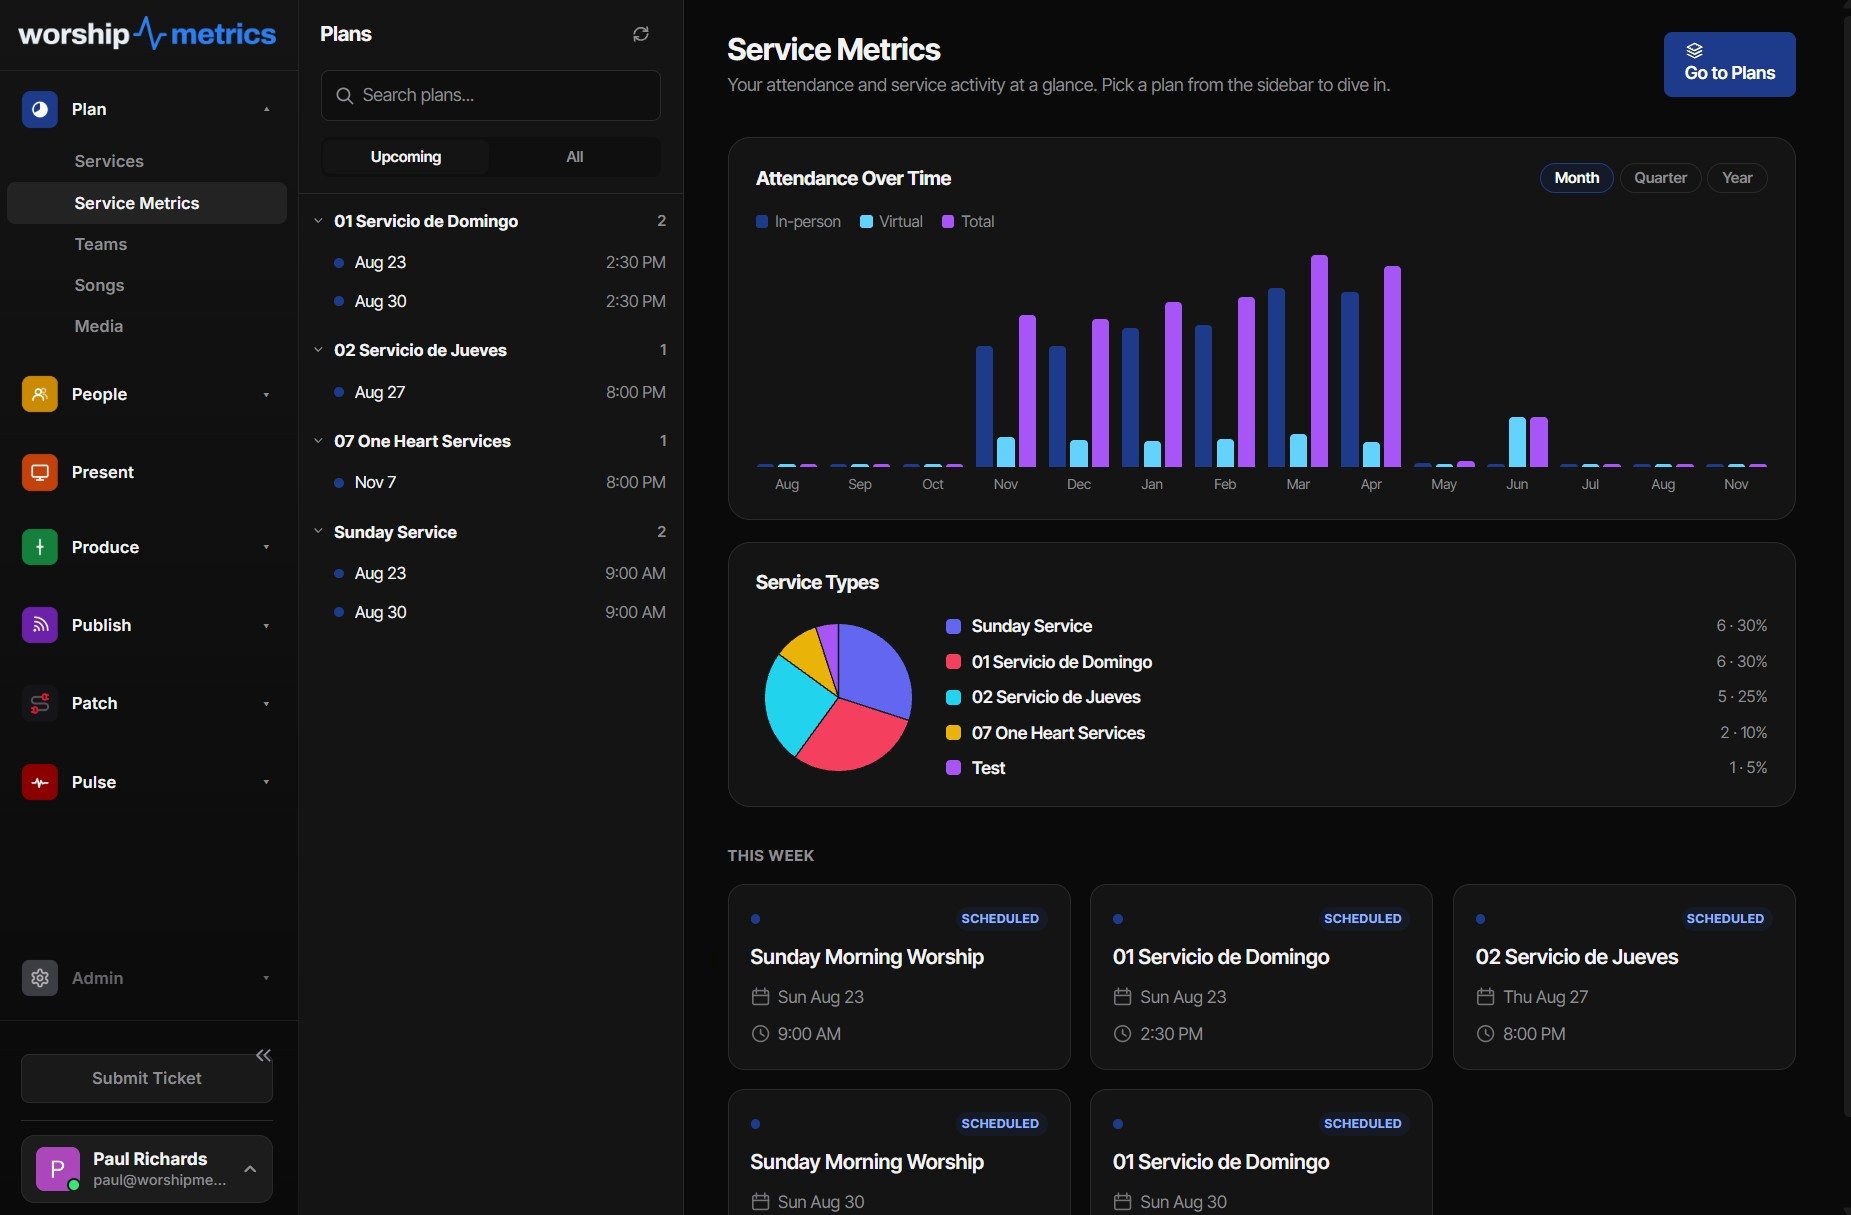
The room is only half the congregation. Service Metrics puts in-person and online attendance on one dashboard (online viewer numbers on Max) — total reach per service, trends across the year, and an honest answer to the question every leader asks: are we growing?
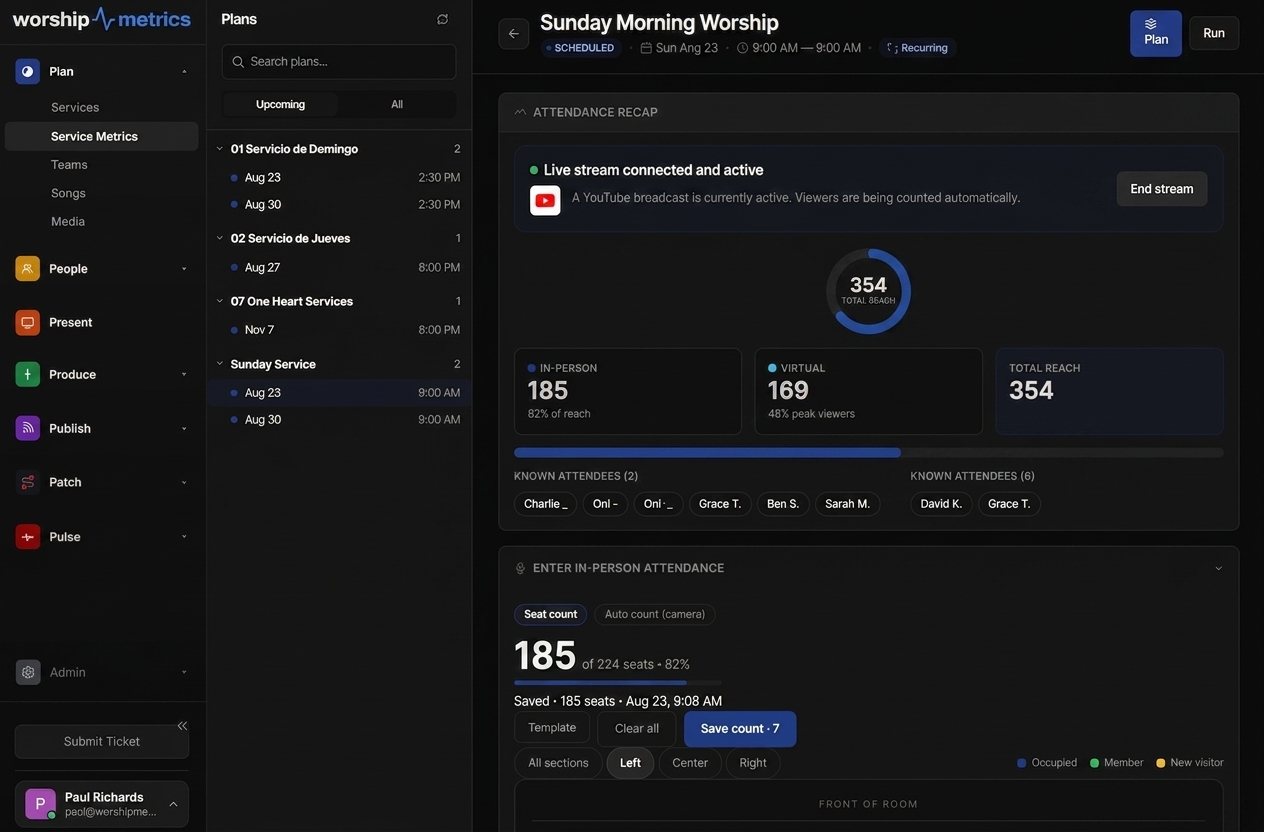
The window into your church
The stream is a front porch. Count who's standing on it.
Almost nobody walks into a church cold anymore — guests watch online first, sometimes for weeks, deciding whether your church is a place they could belong. The stream is a bridge into the building. And the people already on it are not strangers:
The lifelong member — who supported the church for fifty years and now worships from a recliner — still every Sunday, still counted.
The family who moved away — three states over now, still part of the congregation every week.
The traveling parent — in a hotel on Sunday morning, worshiping with their home church anyway.
The not-yet-visitor — quietly watching for weeks, deciding whether your church is safe to walk into.
Healthy churches know their online congregation — who it is, and whether it's growing or stagnant. Service Metrics makes that knowable.

How the number is built
In-person + online = the real picture.
Attendance used to mean a headcount in a notebook. Total Reach counts both congregations — and because every service is stored, the comparisons leaders actually care about are one click away.
It validates the work
Online worship is real ministry. Now leaders can see it.
Every week, an AV team keeps the stream up, shepherds the chat, greets people by name, and responds to a congregation nobody in the building can see. For too long that work has been invisible — hard to measure, easy to undervalue.
Service Metrics changes that. The online audience is counted beside the room, and the team's effort becomes a number a board meeting can see. When leaders can watch the online congregation grow, the people tending it finally get the credit — and the budget conversations get easier.
For church leadership
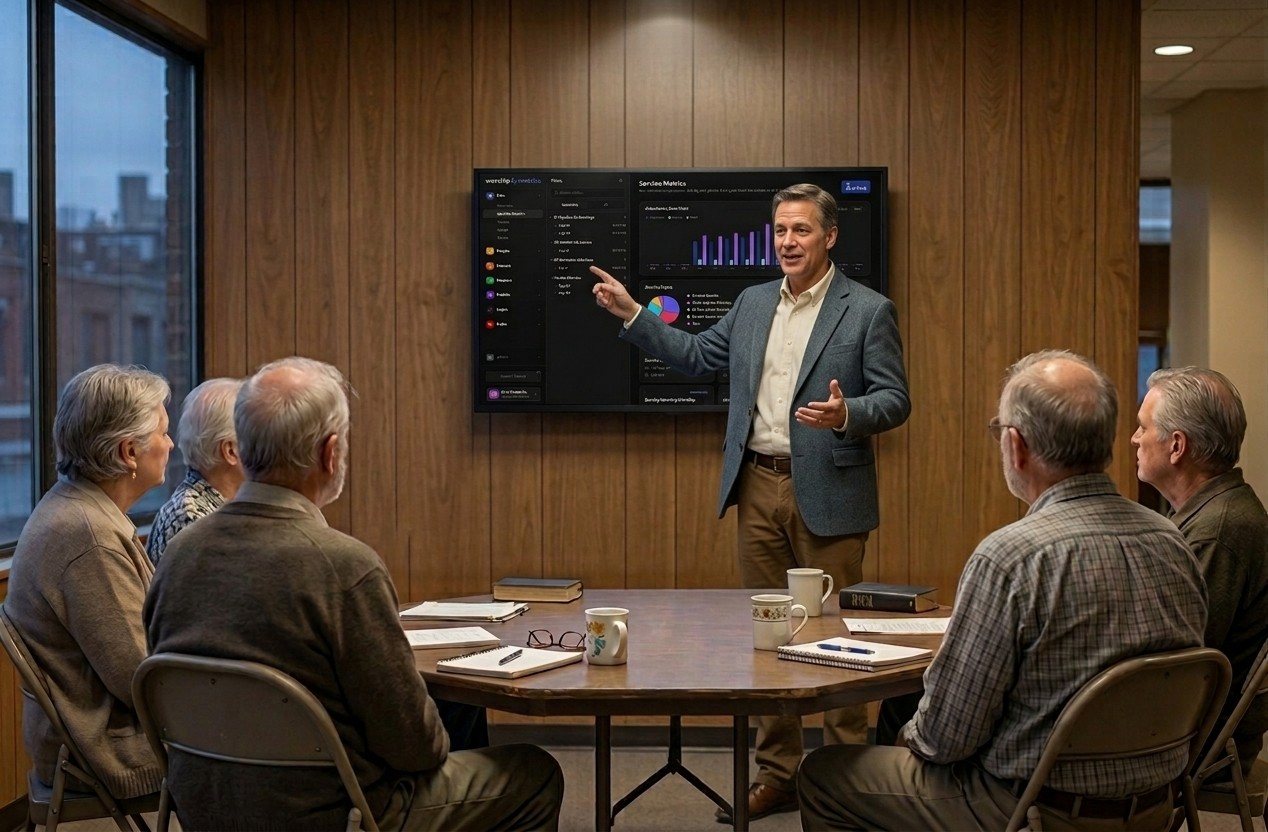
The questions boards ask, answered with data.
Attendance Over Time charts by month, quarter, or year. Every service type broken out. In-person, virtual, and total side by side. Growth stops being a feeling and becomes a fact:
- Did Easter have more or less attendance this year than last year?
- Is the online congregation growing, or quietly going stagnant?
- Which service type reaches the most people — and which reaches furthest online?
- What did that sermon series actually do to attendance?
The catch: year-over-year answers need last year's data. Start gathering it today, and next Easter you'll know.
Beyond attendance
Know which sermons and songs resonate.
Attendance tells you who came. Clip insights tell you what connected. When you clip your services with Reels, you can see which messages and worship songs get the most playbacks and engagement, split between your private WorshipMetrics congregation and YouTube, organized for leadership to review.
FAQ
Service Metrics, answered.
What is Total Reach?
One number for everyone who worshiped with you: the people counted in the room plus the peak concurrent viewers online. In-person and virtual are always shown separately too, so leaders see the shape of the congregation — not just its size.
Where does the in-person count come from?
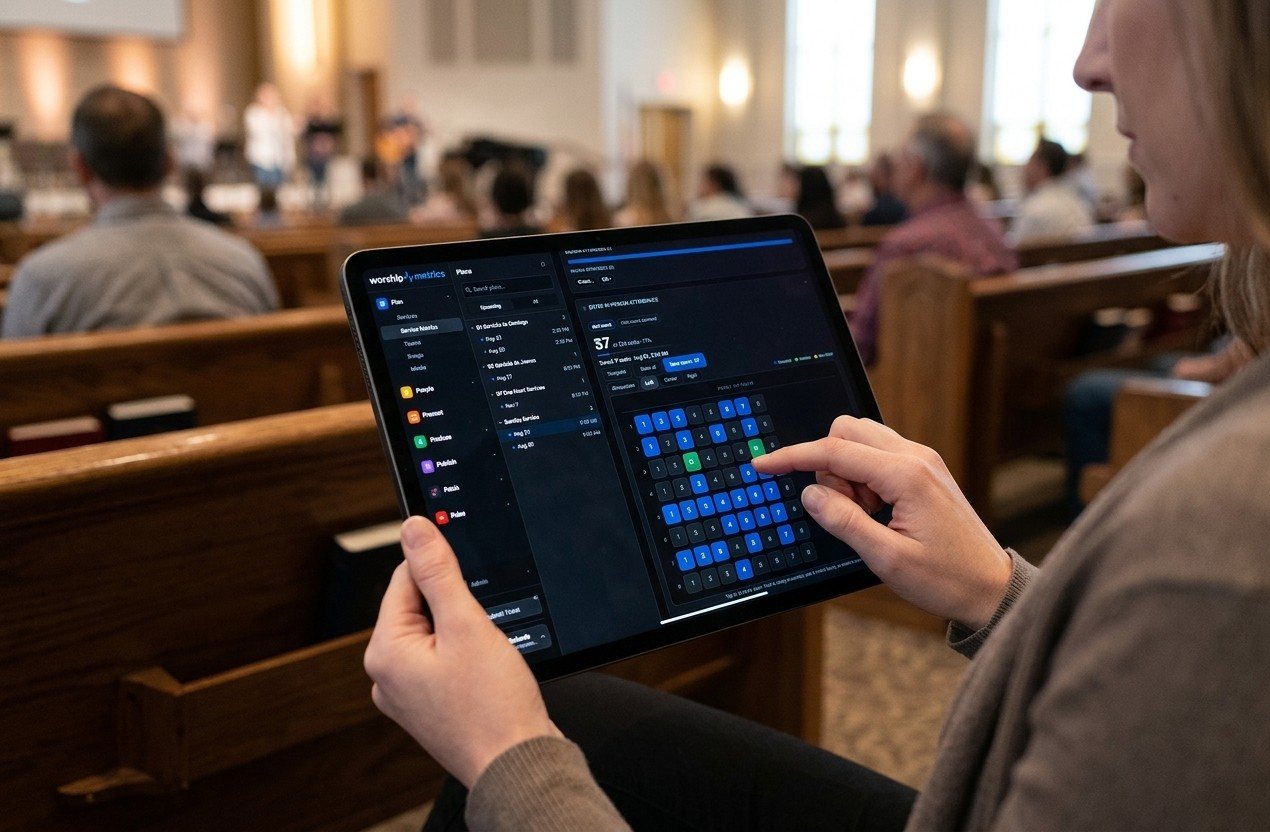
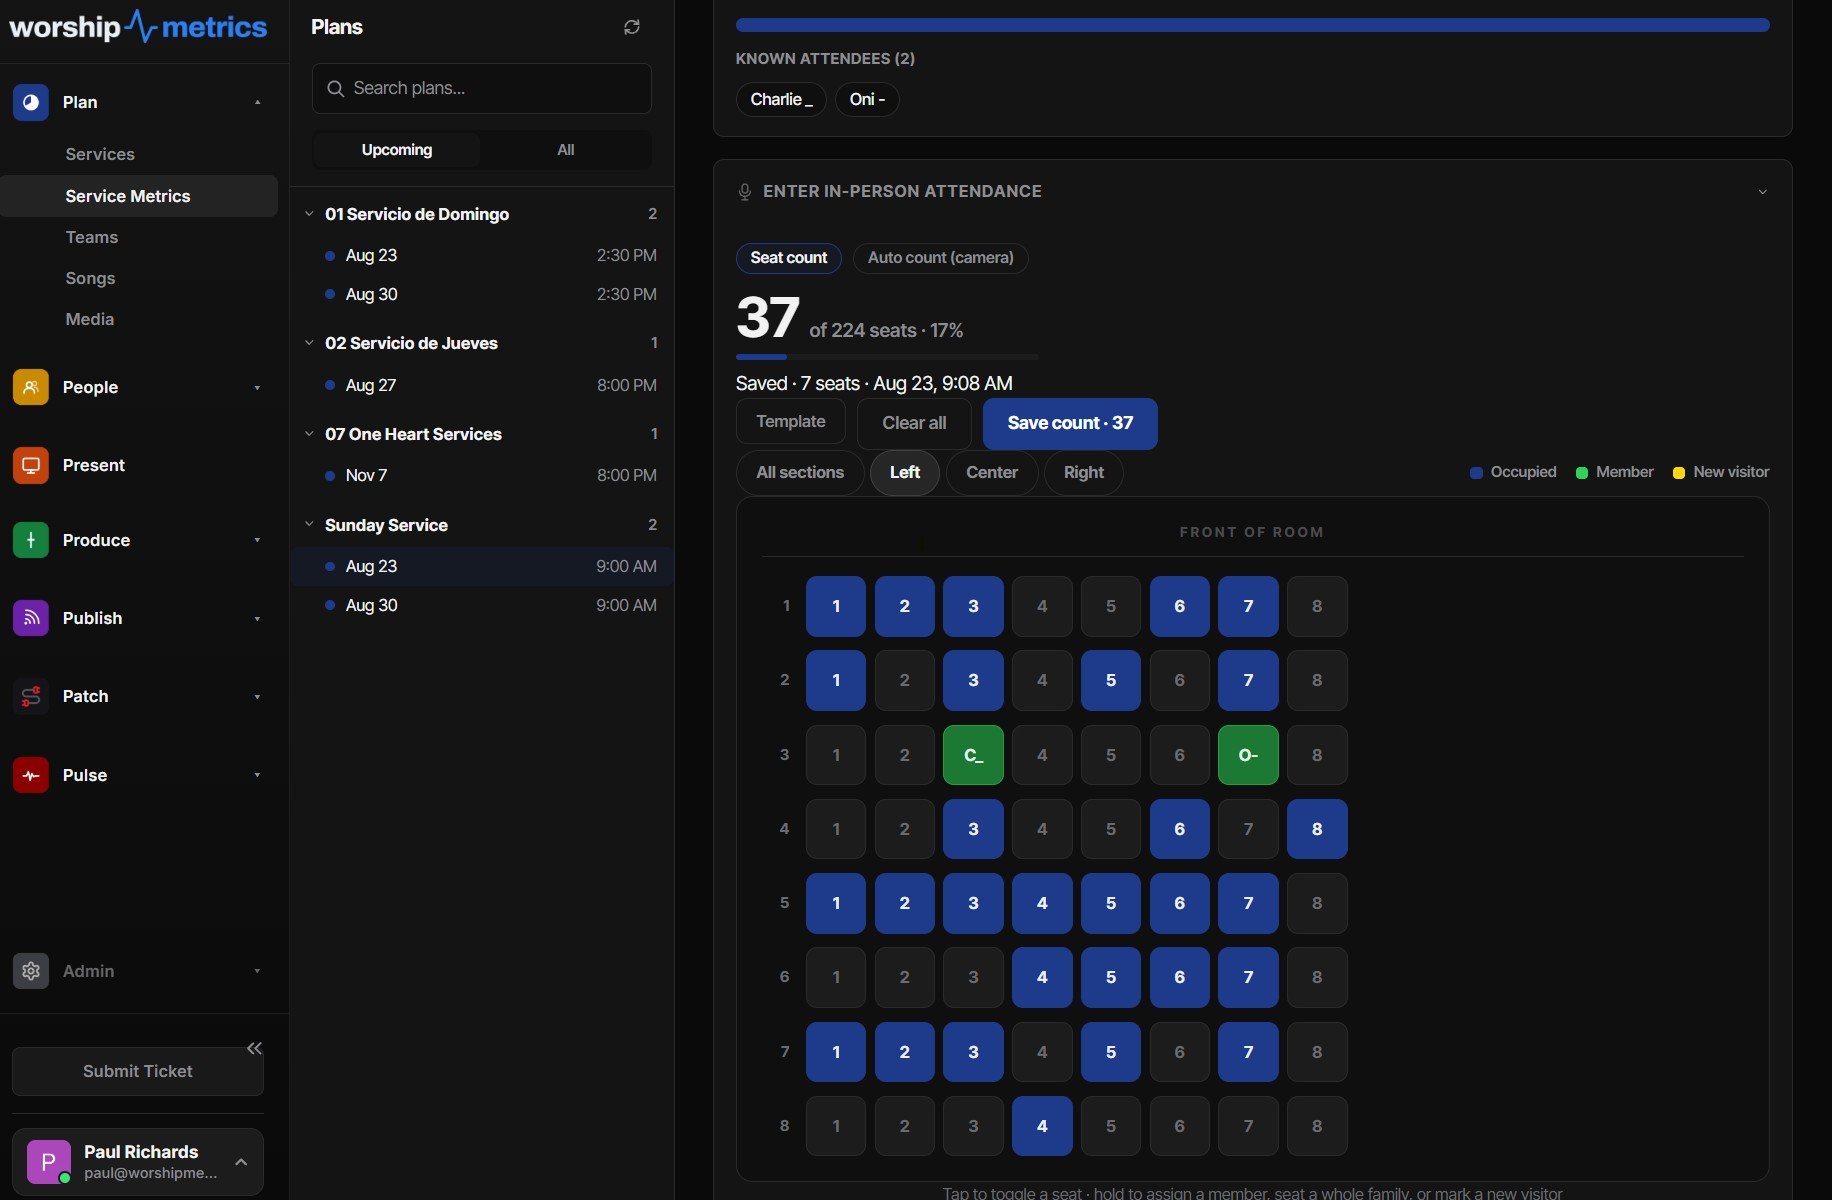
Two ways, both in Tech Manager: a seat-map counter volunteers actually use — tap a seat to toggle it, hold to assign a member or mark a new visitor — or, on Pro and Max, camera Auto-Count, which tallies the room from an RTSP camera or webcam on a schedule or on demand.
Where does the online attendance come from?
On Max, connect your YouTube or Facebook broadcast and viewers are counted automatically, during and after the service — concurrent viewers sampled every minute, with peak and average rolled into that day's attendance when the broadcast ends. Streams through the WorshipMetrics player count the same way.
Can I compare services across time?
Yes — that's the point. Attendance Over Time charts in-person, virtual, and total by month, quarter, or year, and every service type is broken out separately. Easter versus last Easter, this series versus the last one, Sunday morning versus midweek — the comparisons leaders actually ask for.
What does it cost?
In-person counting with the seat map ships in the free platform; camera Auto-Count comes with Pro and Max. Automatic online viewer analytics comes with the Max plan, alongside hosted live streaming and the stream reports. See pricing for the full picture.
Related: how attendance counting works · service planning · stream health reports (Max)
Start gathering the data today.
Next year's Easter comparison starts with this Sunday's count. Set up the seat map, connect the broadcast, and give your leaders the dashboard — so you're prepared for the growing church of tomorrow.
From the Knowledge Base
Attendance questions leaders actually ask.
Modernize your AV · Instant tech support
Download Tech Manager free — and put a tech support number in the booth.
Tech Manager connects your church's AV system to WorshipMetrics: documented, monitored around the clock while it runs (it starts with the computer), and backed by a number your team can call the moment anything acts up. Our AI support sees your actual system — so issues get solved before frustration starts.
New to us? Call and we'll put you in touch with the team. How phone support works →
Tech support, any time
910-WORSHIP(910) 967-7447
AI phone support any hour on Pro and Max · a person on the line with Care or Sunday Assurance.