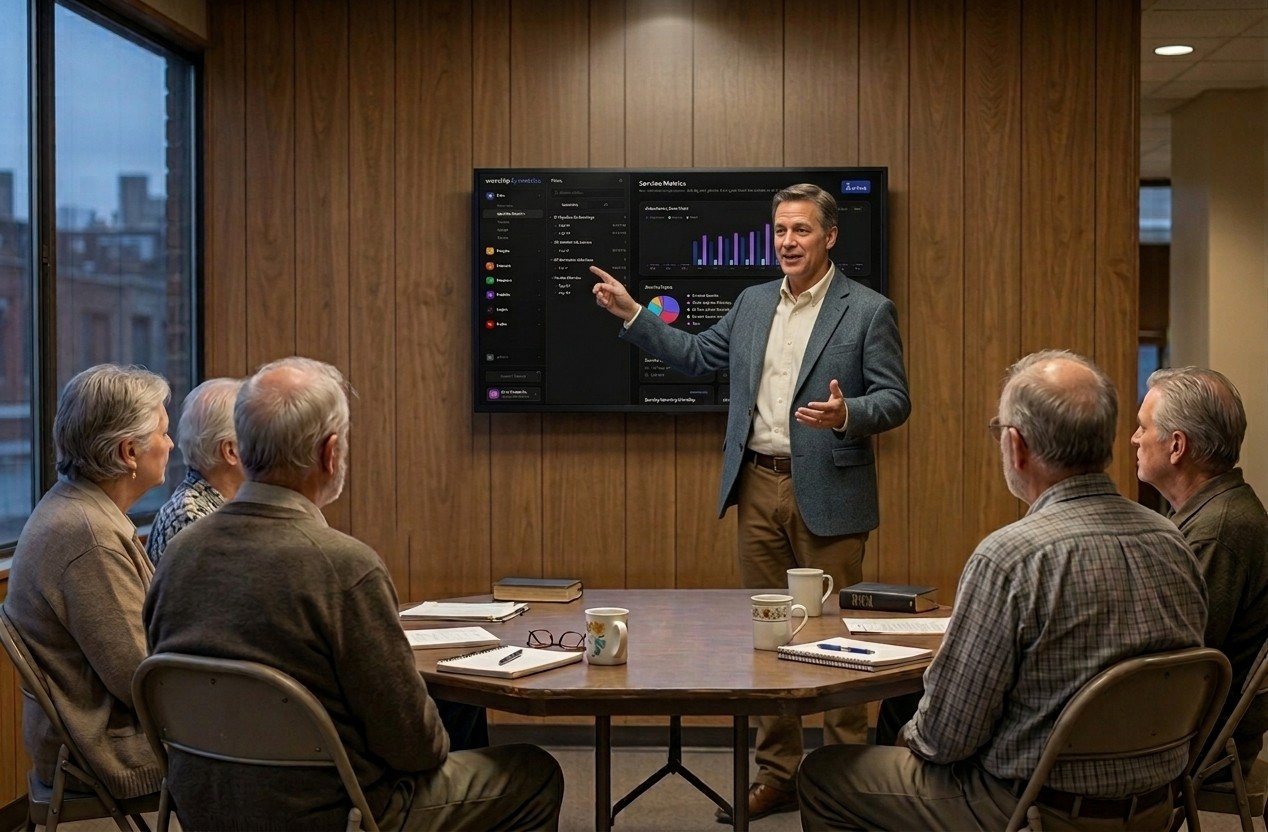
The short answer: one dashboard answers both Monday questions
Every Monday morning, a pastor quietly wants the answers to two questions: did Sunday work? and are we growing? In most churches, both answers currently live in other people’s heads — the tech director knows whether the stream struggled, an usher has a headcount on a sticky note, and nobody knows how many people worshiped online.
With WorshipMetrics, both answers are on a dashboard before the first coffee. Service Metrics shows the service’s total reach — in-person and online attendance, together and separately — and the stream carries a health score from 0 to 100 with plain-English notes. No text messages, no putting the tech volunteer on the spot, no wondering whether “it went fine” means fine.
Here’s what that Monday look actually contains, and where each number comes from.
”Did it work?” — the stream health score
Every streamed service gets a single 0-100 score summarizing what the encoder and booth computer experienced while live: bitrate stability, dropped frames, frame rate, encoder load, and the machine’s own vital signs, sampled every five seconds all service long. A 94 means the online congregation had a smooth morning. A 61 comes with specific, readable reasons — and every deduction ships with a recommendation, so the score reads less like a verdict and more like a to-do list for the team.
The pastor doesn’t need to parse any of the telemetry; that’s the point of the number. But it changes the Monday conversation from “how was the stream?” (answer: a shrug) to “I saw we scored 88 with one reconnect — anything the team needs?” — which is a genuinely encouraging question to receive in the booth. The full scoring system is explained in reading your stream health score.
Two companion signals round out the “did it work” picture:
- The alert feed. Pulse monitoring watches every booth machine and device around the clock and keeps 90 days of alert history. A quiet feed is trustworthy by design — thresholds and anti-noise rules are published exactly — so silence really does mean healthy.
- The Self Healing log. If the stream stopped at 10:42 and a volunteer tapped Restart, the log shows it — who answered, from where, and whether it worked. Leadership seeing that the team caught and handled a problem is very different from leadership never knowing there was one.
”Are we growing?” — total reach, honestly counted
The room is only half the congregation. The homebound member who gave faithfully for fifty years, the family three states away, the not-yet-visitor who’s been quietly watching for a month deciding whether your church is safe to walk into — they all worshiped with you, and a headcount on a sticky note misses every one of them.
Service Metrics counts both halves:
- In the room: volunteers use a seat-map counter in Tech Manager — tap a seat to toggle it, hold to mark a member or first-time visitor — or camera Auto-Count tallies the room automatically from an RTSP camera or webcam, on a schedule or on demand. (Setup for that is in the camera Auto-Count guide.)
- Online: connect your YouTube or Facebook broadcast and viewers are counted automatically — concurrent viewers sampled every minute, with peak and average rolled into that day’s attendance when the broadcast ends. Streams through the WorshipMetrics player count the same way.
Total reach is the sum a leader can actually use: everyone who worshiped, with the in-person and online shapes always visible separately. And because every service is stored the same way, Attendance Over Time answers the questions leadership meetings actually ask — Easter versus last Easter, this sermon series versus the last one, whether the online congregation is growing or quietly going stagnant — by month, quarter, or year, per service type.
What this changes for the tech team
It’s worth saying plainly: the goal isn’t surveillance of the booth, and the gracious framing matters. What the dashboard removes is the interrogation — the volunteer who gave up their Sunday morning no longer fields “so did it work?” texts, because the answer is self-serve. What it adds is recognition: a string of healthy scores is visible evidence of work that used to be invisible precisely when it was done well.
It also makes the ask for resources concrete. “We need a better internet plan” lands differently when the health reports show bitrate sagging during greeting time three weeks running. Numbers turn hunches into a budget line — our guide to AV budget planning picks up that thread.
How WorshipMetrics handles this
Everything above is one platform doing its quiet work: Tech Manager counts the room and reports the booth’s health, Pulse watches the fleet and keeps the alert history, live streaming produces the health report for every service, and Service Metrics rolls it all into the dashboard a leader checks in ninety seconds on Monday morning. Seat-map counting ships in the free platform; camera Auto-Count comes with Pro and Max, and automatic online viewer analytics and the after-service stream report with Max. The pastor gets honest answers, the tech team gets credit for invisible excellence, and “are we growing?” finally gets answered with data instead of a feeling.
Related questions
- What is Total Reach?
- One number for everyone who worshiped with you: the people counted in the room plus the peak concurrent viewers online. In-person and virtual are always shown separately too, so leaders see the shape of the congregation, not just its size.
- Does the pastor need to understand the technical details?
- No. The stream health score is a single 0-100 number per service, and every deduction comes with a plain-English recommendation. A quiet alert feed means the booth was genuinely healthy — the monitoring is designed so silence is trustworthy.
- Can leaders compare attendance across services and years?
- Yes — Attendance Over Time charts in-person, virtual, and total by month, quarter, or year, with every service type broken out separately. Easter versus last Easter, this sermon series versus the last one, Sunday morning versus midweek.
What Counts as Attendance When Half the Congregation Watches Online?
NextHow Do I Get Sunday's Sermon Onto Instagram Before Monday?
Related Articles
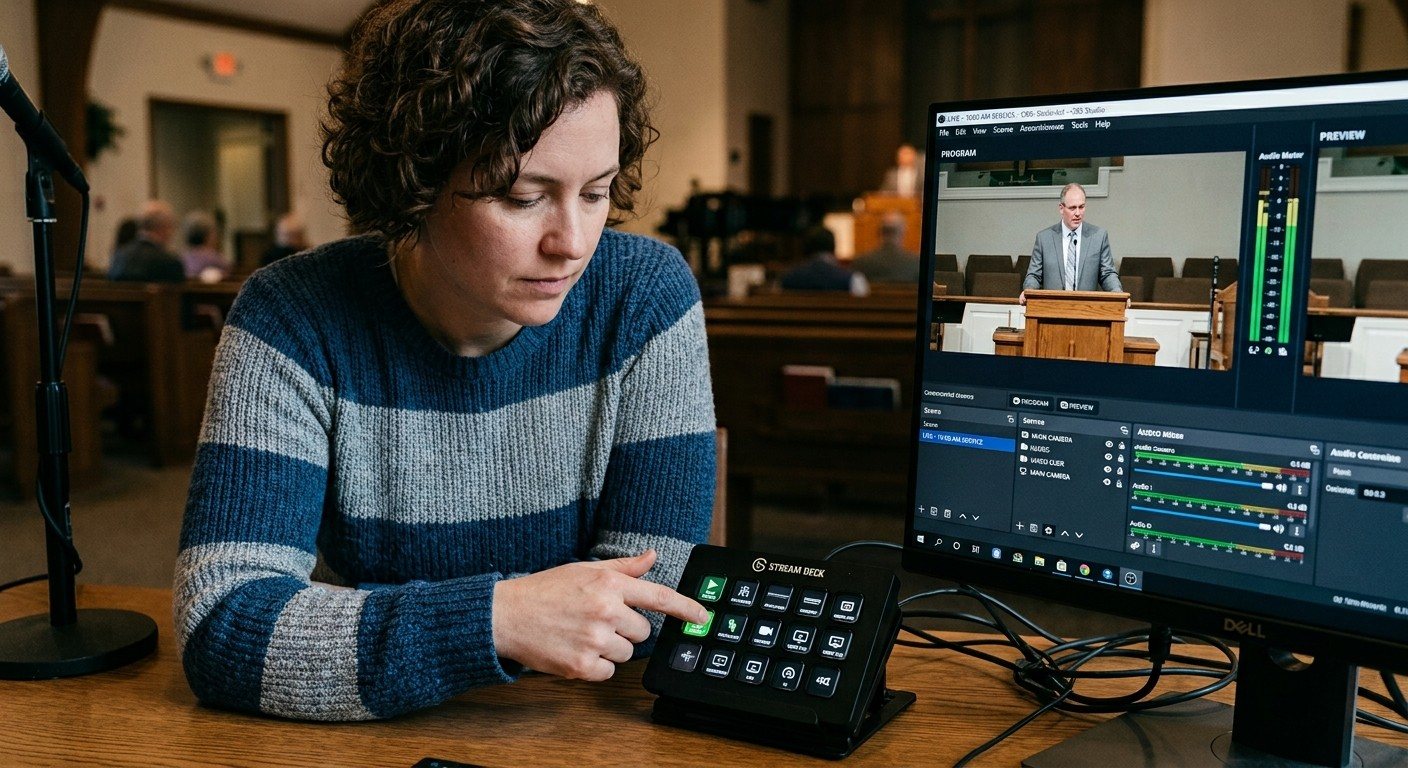
Making a Complicated Church AV System Easy to Run, Without Hiring an AV Company
Many church AV systems aren't too old or too small. They're too complicated for a volunteer. A simple button panel built with Bitfocus Companion can hide that complexity behind plain-word buttons, and a church can often build it themselves. Here's when that works, when to call a professional, and how to start.
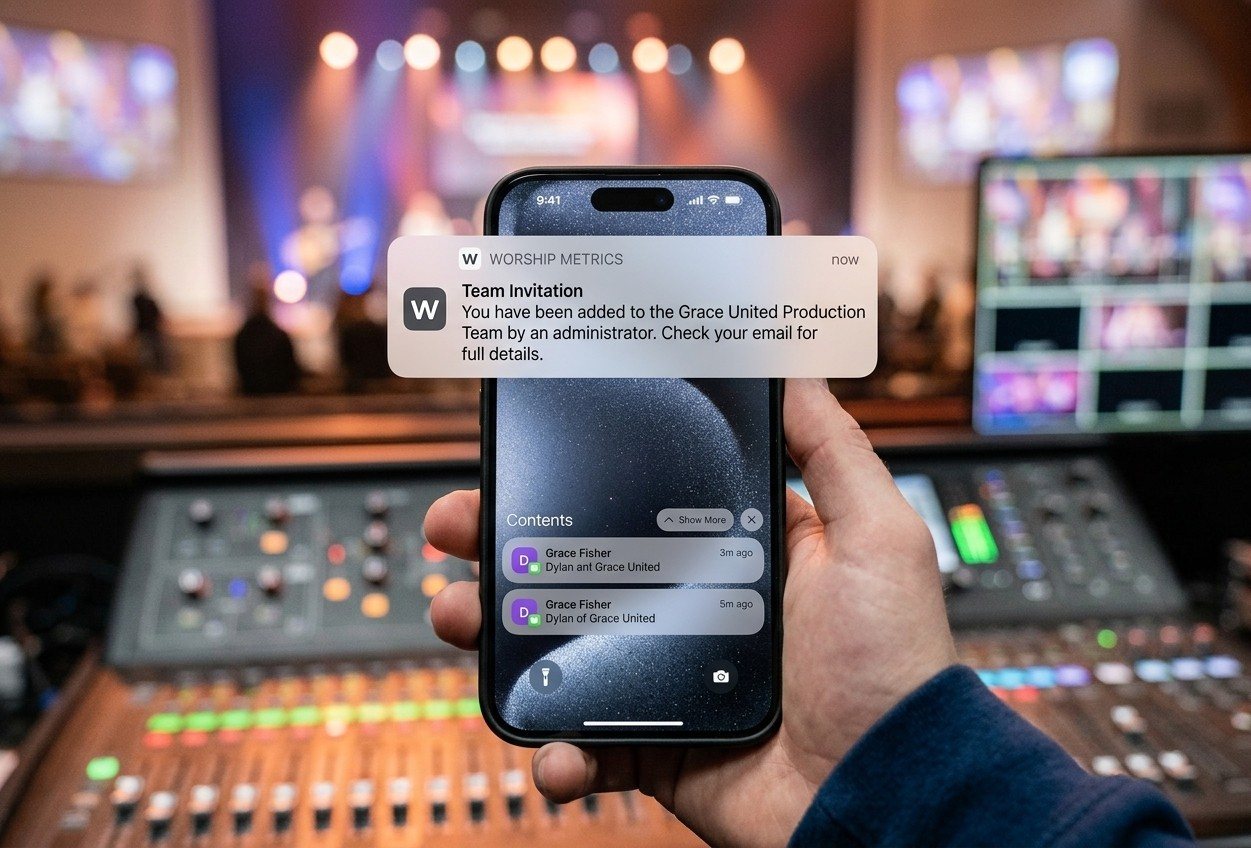
Your Church Livestream Team, Connected Even When They're Not at Church
A three-person livestream team only works if everyone shares the same plan, the same wiring diagram, and the same news when something breaks. Here's how WorshipMetrics connects the director, slides, and camera volunteers through the week: chat, alerts, documentation, AI help, scheduling, and cloud control for OBS and vMix.
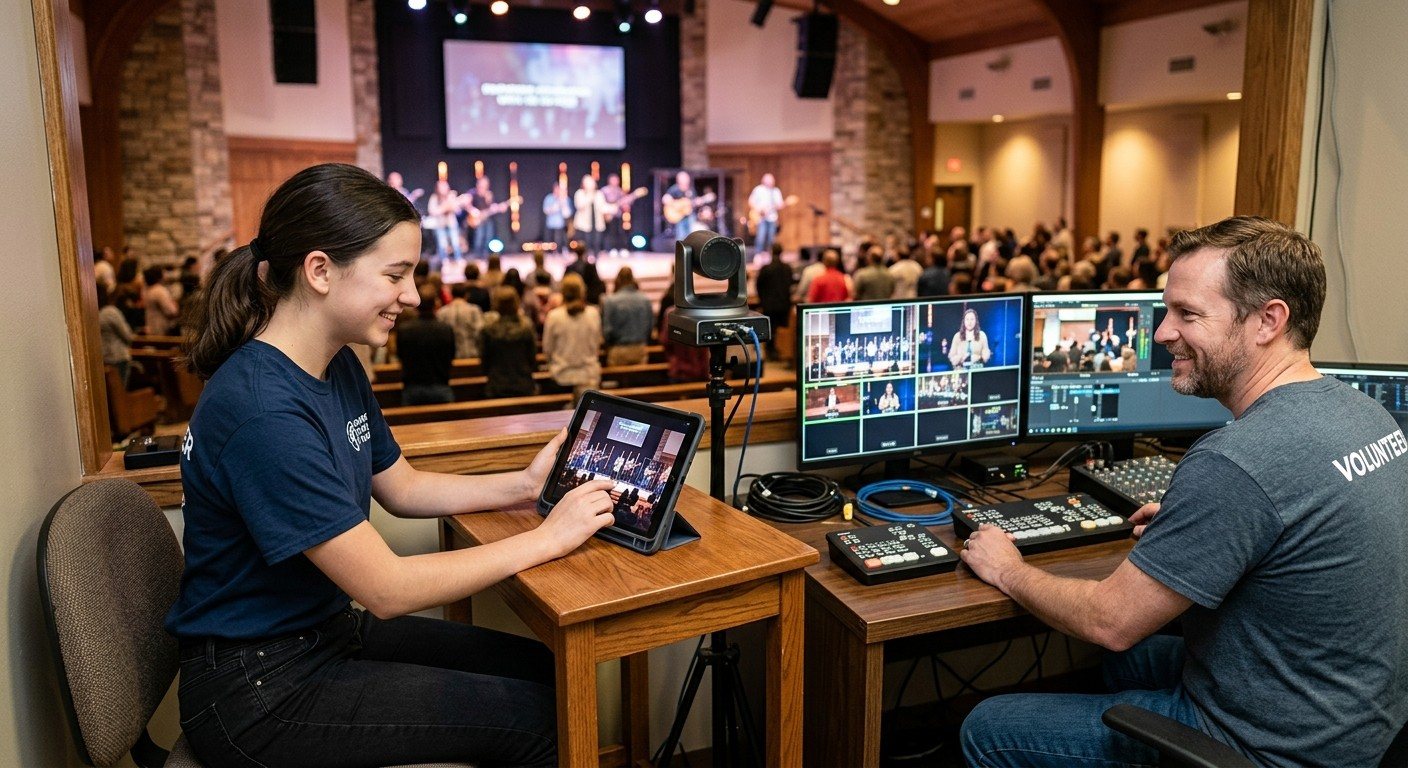
The Three-Person Church Livestream Team: Director, Slides, and Cameras
A church livestream runs best with three clear jobs: a director on OBS or vMix, a slides operator, and a camera operator. Here's what each role does before, during, and after the service, what skills it takes, and how the three talk to each other.