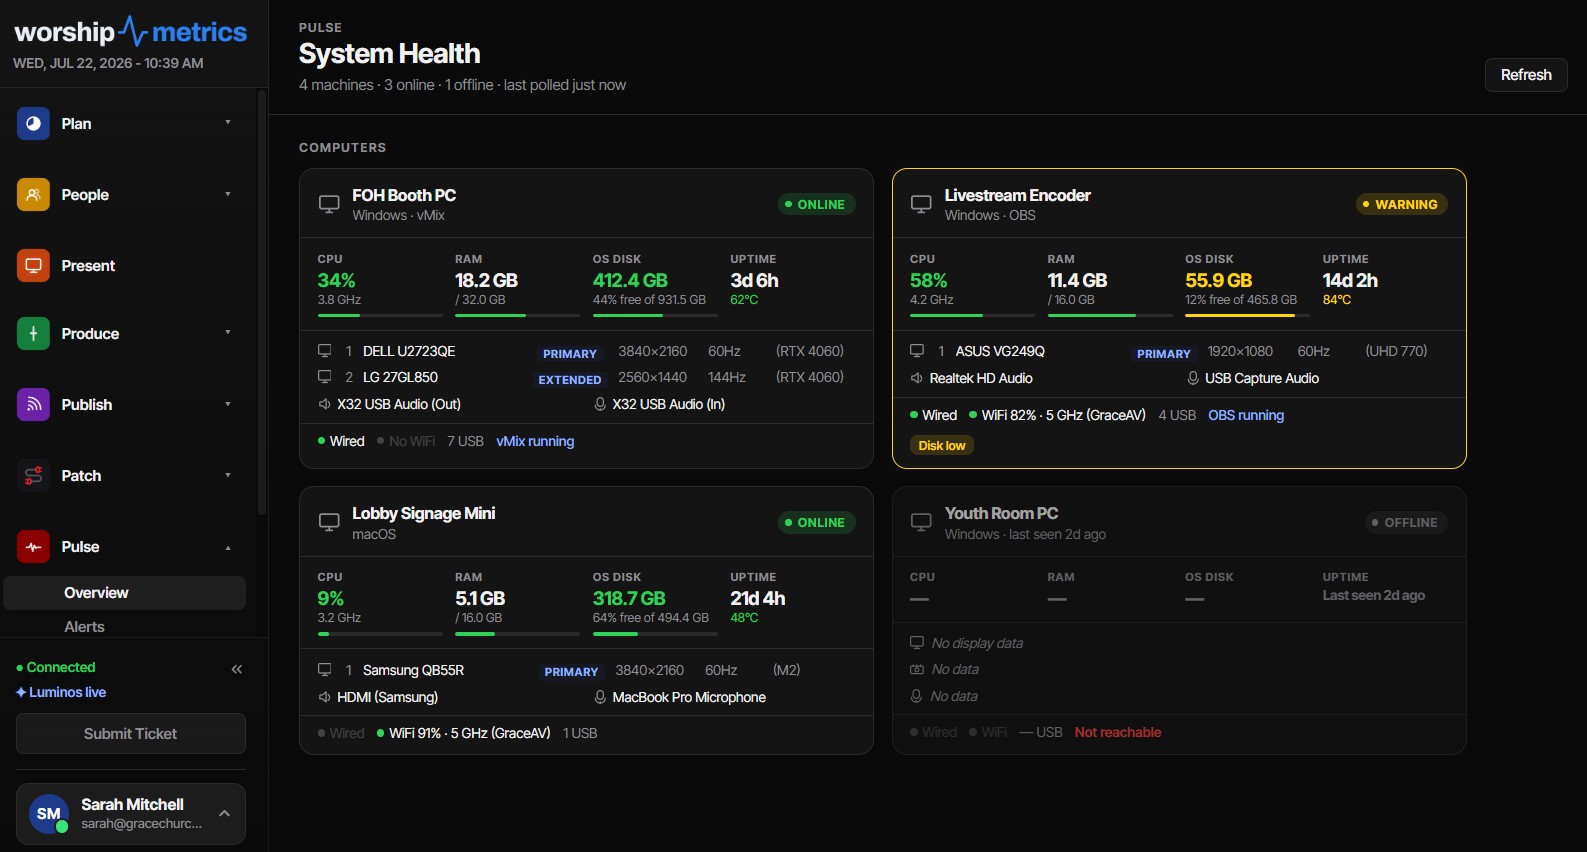
Why we publish the exact numbers
Most monitoring products treat their alert logic as a black box: something felt wrong, so you got an email. That works fine until the first false alarm on a Saturday night — or worse, the first real problem that never alerted at all. After that, nobody on the team trusts the tool.
A church AV team runs on trust in silence. If Pulse is quiet, the booth should genuinely be healthy; if Pulse speaks up, it should genuinely be worth walking to the booth. That only works if everyone — the tech director, the Sunday volunteer, the pastor glancing at a phone — knows exactly where the lines are. So here they are: every threshold, every recovery margin, every cooldown, in one reference.
The resource red lines
Every computer running the Tech Manager desktop app reports CPU load, memory, disk space, and CPU temperature continuously. Four conditions trip a critical resource alert:
| Condition | Alert trips at | Recovers below | Re-alert cooldown |
|---|---|---|---|
| CPU load | ≥ 90% | 85% | 30 minutes |
| RAM used | ≥ 90% | 85% | 30 minutes |
| Disk free space | ≤ 5% | 8% free | 30 minutes |
| CPU temperature | ≥ 95°C | 92°C | 30 minutes |
Why these particular numbers:
- CPU at 90% is where live production starts to hurt. Encoders drop frames, presentation software stutters on slide transitions, and audio interfaces begin to crackle long before the machine actually pins at 100%. Ninety percent is the last point where you can still intervene gracefully — close the browser someone left open, pause the backup, lower a bitrate.
- RAM at 90% means the operating system is about to start paging to disk, and on a machine that is also encoding video, paging is where “a little slow” becomes “frozen mid-service.”
- Disk at 5% free is the recording killer. A multitrack capture or a local stream recording can eat gigabytes per hour, and Windows itself misbehaves when the system drive runs dry. Five percent is the alarm; it should never get there if you act on it.
- 95°C is throttle territory for nearly every modern CPU. A booth machine that hot is either choked with dust, sitting in a sealed cabinet, or running a failed fan — all fixable on a Tuesday, none fixable at 9:58 on a Sunday morning.
One detail worth knowing: the alert email and the on-screen badge read from the same constants. What you see in the app and what lands in your inbox can never disagree about where the line is.
Hysteresis: why the recovery number is different
Notice that every alert recovers at a different value than the one that tripped it. That gap is called hysteresis, and it exists because real machines hover.
Imagine a CPU bouncing between 89% and 91% during a render. If the alert tripped at 90% and cleared at 90%, you would get an alert, a recovery, an alert, a recovery — dozens of emails describing one ongoing situation. Instead, Pulse requires the machine to fall meaningfully back inside the safe zone (85% for CPU and RAM, 8% free for disk, 92°C for temperature) before the alert is considered resolved and eligible to fire again.
On top of hysteresis sits a 30-minute cooldown per machine: even a machine that legitimately trips, recovers, and trips again sends at most one re-alert per half hour. Between the two mechanisms, a flapping device produces one email per incident — not forty.
Offline detection: 90 seconds to the badge, five minutes to the email
Offline detection runs on layered heartbeats from each booth machine:
- A light telemetry beat every 15 seconds — CPU, RAM, temperature, uptime — over a persistent WebSocket connection, with an HTTPS fallback if the socket is blocked.
- A full heartbeat every 60 seconds carrying the complete hardware snapshot and the health of every AV device that machine watches.
From those beats, two different offline thresholds serve two different purposes:
| Signal | Threshold | Purpose |
|---|---|---|
| Online badge flips to offline | 90 seconds without a heartbeat (three missed light beats) | Fast, honest status in the Pulse machine grid |
| Offline alert email | More than 5 minutes of silence | High-confidence “this is a real outage” notification |
| WebSocket drop | Caught in ~60 seconds by a grace timer | Catches a yanked cable faster than the polling cycle |
| Monitored AV gear (cameras, consoles, switchers) | Configurable per device, default 60 seconds | Tunable to how twitchy each device’s network is |
| Signage screens | 30 minutes | Displays that sleep on schedule shouldn’t page anyone |
The 90-second badge and the 5-minute email are deliberately different. A badge can afford to be jumpy — it costs nothing to glance at. An email interrupts someone’s evening, so it waits long enough to rule out a router hiccup or a brief WiFi renegotiation.
Two properties make this trustworthy in practice. First, the offline check runs server-side every five minutes whether or not anyone has a page open — detection never depends on a human watching a dashboard. Second, each outage alerts exactly once: an atomic claim in the database guarantees that even if multiple checks race, only one email goes out, and when the machine comes back the alert auto-resolves in the feed.
Monitored AV gear: everyone has to agree it’s down
Booth computers aren’t the only things Pulse watches. Cameras, digital consoles, switchers, and other networked gear flagged “Alert when offline” get monitored too — but with an important twist.
A single booth machine losing its path to a camera doesn’t prove the camera is down. Maybe a switch port died, maybe someone unplugged the wrong patch cable, maybe that machine’s own NIC is flaky. So Pulse uses a multi-observer rollup: a monitored device only alarms when it is unreachable from every telemetry machine on the network. One booth’s bad network path can never page your whole team about a camera that is actually fine.
The rollup produces five honest states — online, degraded, stale, offline, unknown — and only fresh observers get a vote. A booth machine that has gone quiet for 10 minutes is excluded from the decision, and a device whose only observers have all gone quiet is shown as stale rather than frozen at a misleading “online.” The per-device alert delay defaults to 60 seconds and is configurable, so a camera on a congested VLAN can be given more slack than the console sitting one switch hop away.
If your gear list lives in a spreadsheet today, this rollup is one of the better arguments for keeping a live AV inventory instead — and if devices on your network drop out more than they should, the underlying fix is usually network design, not monitoring.
Stream drops and silent audio
Two more alert types round out the picture:
- Livestream drop. Heartbeats carry encoder telemetry from OBS or vMix — bitrate versus target, dropped-frame percentage, encoder load, frame rate, current scene. If a stream leaves the “live” state for any reason other than someone pressing Stop in the app, the organization’s owner, admins, and operators get a drop-alert email within one cooldown window. If that ever happens to you mid-service, we’ve written a calm recovery playbook for exactly that moment.
- Silent audio. Alerts the team when the stream’s audio goes silent (vMix, while streaming or recording) — the alert that catches the classic “the stream was perfect except it was silent” failure.
Pattern detection: the thresholds behind “Needs attention”
Some problems never trip a single red line but are obvious across time or across devices. Pulse Insights watches for those patterns, with its own published thresholds:
- Packet loss ≥ 20% on a device’s network path
- Latency at 2× that device’s own baseline (and at least 30 ms) — measured against its normal, not a universal number
- The same alert flapping 4+ times in 24 hours
- Recorder media running low — flagged below 30 minutes remaining, urgently below 10
- A machine silent for over an hour
And one escalation rule that matters for multi-room and multi-campus churches: an issue spanning three or more devices escalates from warning to critical automatically. One flaky camera is a nuisance; five at once is the network.
Where the alerts reach you
Thresholds only matter if the alert lands somewhere someone will see it:
- Email is the guaranteed channel — every critical alert produces one.
- Text messages reach anyone who opts in.
- In-app notifications are always written, so the record exists even if a message is missed.
- Desktop notifications on the booth computer notify anyone working there.
- Open Pulse pages update live — no refresh needed to see an alert appear or resolve.
Every alert carries a severity (info, warning, critical) and one of six areas (Hardware, System, Stream, Audio, Network, Other). Each team member can subscribe per alert type and tune which areas reach which channels, so the volunteer who runs audio isn’t paged about a signage screen. The full alert feed keeps 90 days of history with severity and area filters — enough to answer “has this happened before?” with data instead of memory. That history is also a genuinely useful training tool for volunteer teams: reviewing last month’s alerts together teaches failure patterns faster than any hypothetical.
How WorshipMetrics handles this
Everything in this reference is the standing behavior of Pulse, the monitoring layer of WorshipMetrics: the Tech Manager desktop app collects telemetry from every booth machine, the cloud watches the fleet around the clock, and the thresholds above decide — consistently, and in the open — when your team hears about it. Stream-health telemetry flows in automatically from the same heartbeats that power live streaming, so there is nothing extra to configure to get drop alerts.
The numbers are deliberate, the anti-flap mechanics are deliberate, and none of it is tunable into meaninglessness: when Pulse is quiet, your booth is healthy, and when it speaks, it’s worth the walk.
Firing Lights, Switchers, and Sound from Your Slides: Protocol Triggers in Present
NextReading Your Stream Health Score: What the 0-100 Number Actually Means
Related Articles
Making a Complicated Church AV System Easy to Run, Without Hiring an AV Company
Many church AV systems aren't too old or too small. They're too complicated for a volunteer. A simple button panel built with Bitfocus Companion can hide that complexity behind plain-word buttons, and a church can often build it themselves. Here's when that works, when to call a professional, and how to start.
Your Church Livestream Team, Connected Even When They're Not at Church
A three-person livestream team only works if everyone shares the same plan, the same wiring diagram, and the same news when something breaks. Here's how WorshipMetrics connects the director, slides, and camera volunteers through the week: chat, alerts, documentation, AI help, scheduling, and cloud control for OBS and vMix.
The Three-Person Church Livestream Team: Director, Slides, and Cameras
A church livestream runs best with three clear jobs: a director on OBS or vMix, a slides operator, and a camera operator. Here's what each role does before, during, and after the service, what skills it takes, and how the three talk to each other.