 Pulse
Pulse
Professional AV Monitoring.
Pulse watches your booth computers, devices, and streams while Tech Manager is running in your booth (it starts with the computer) — free forever. Alerts reach you when a stream or device has a problem, often before anyone notices. It's the reason our support can immediately help you with detailed advice to get to the bottom of any issue.
Stream health monitoring is included in Tech Manager.
What it monitors
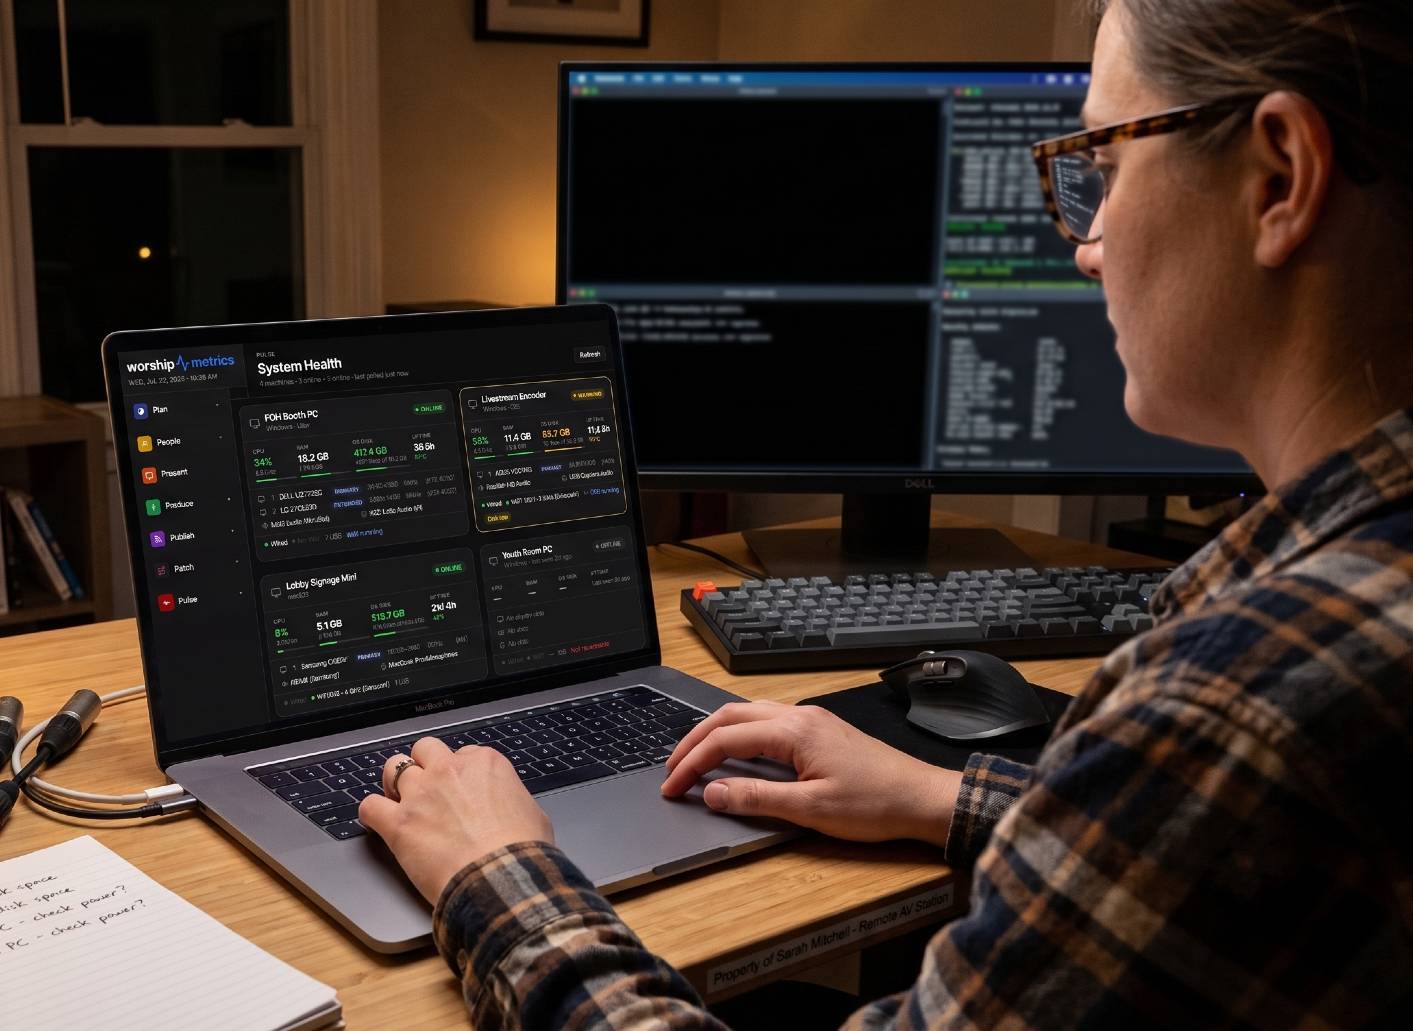
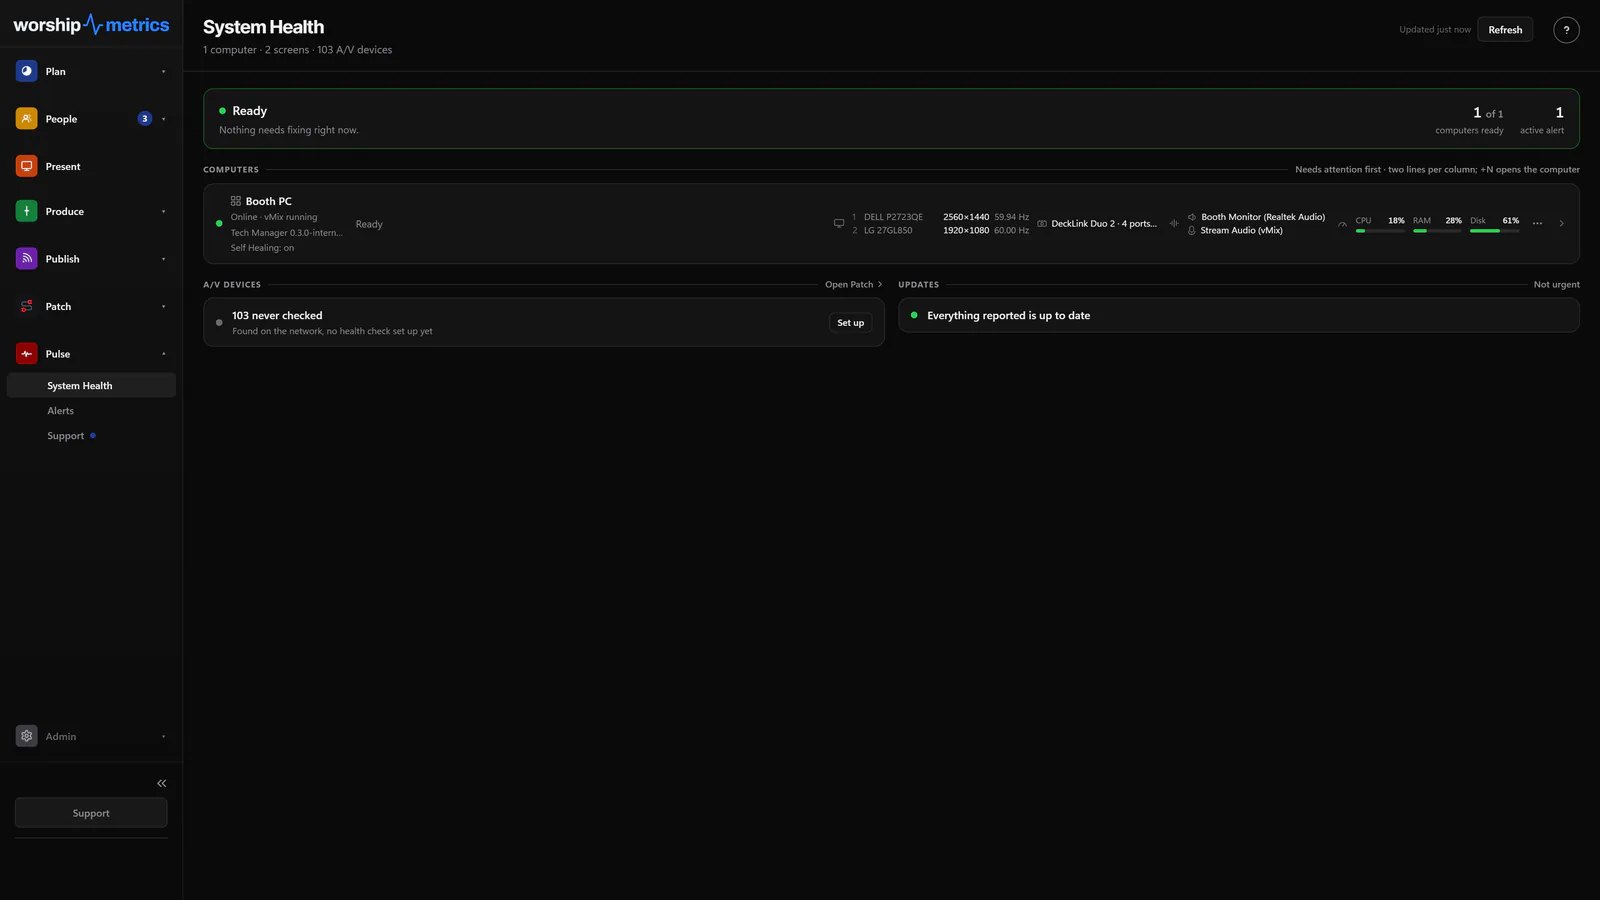
One dashboard for everything that keeps your service running.
AV Monitoring gives you visibility into your livestream, your connected devices, and your overall system health. The same tool that runs the service also watches it.
Full-machine telemetry
Every booth PC reports CPU load and temperature, RAM, every disk with its model, GPU and driver version, every display with resolution and refresh rate, audio endpoints with volume and mute state, USB peripherals, and WiFi signal strength.
Heartbeats every 15 seconds
A light telemetry beat lands every 15 seconds and a full snapshot every minute, so the fleet view is seconds-fresh. A machine earns its offline badge after 90 seconds without one.
Monitoring that needs no watcher
A server-side fleet watcher scans continuously whether or not anyone has a page open. An outage alerts exactly once per incident — and a dropped connection is caught in about a minute.
Red lines that don't cry wolf
CPU at 90%, RAM at 90%, disk under 5% free, or CPU at 95°C trips a critical alert. Recovery requires genuinely cooling off, and re-alerts are capped — a flapping machine sends one email, not forty.
Stream drop alerts
Heartbeats carry bitrate versus target, dropped frames, encoder load, and fps — plus network latency, jitter, and packet loss, and audio silence and clipping detection. If the stream dies mid-service, the alert beats the congregation's text messages.
AV gear health, multi-witnessed
Cameras, consoles, and switchers flagged for monitoring only alarm when every telemetry machine on the network agrees they're unreachable — one booth's bad network path can never page your whole team falsely.
Alerts that reach your team
Alerts by email, text message (for anyone who opts in), and desktop notifications on the booth computer, plus an in-app feed that never misses. You choose channels per person, per alert type.
The machine's timeline
USB plugged and unplugged, displays changed, software and drivers installed or updated, network up and down, sustained CPU spikes, and every remote action — merged into one filterable per-machine history.
Pulse Insights
Pattern detection across the whole org surfaces what no single event shows: packet loss over 20%, latency running twice a device's own baseline, the same alert flapping four times in a day, machines gone quiet.
Service Metrics & attendance
Each week's plan pairs with its recap: in-room attendance from a seat-map counter with reusable templates or a camera auto-count, and, on Max, online viewers rolled in automatically from the stream.
Booth observability
Stop checking each piece of gear individually.
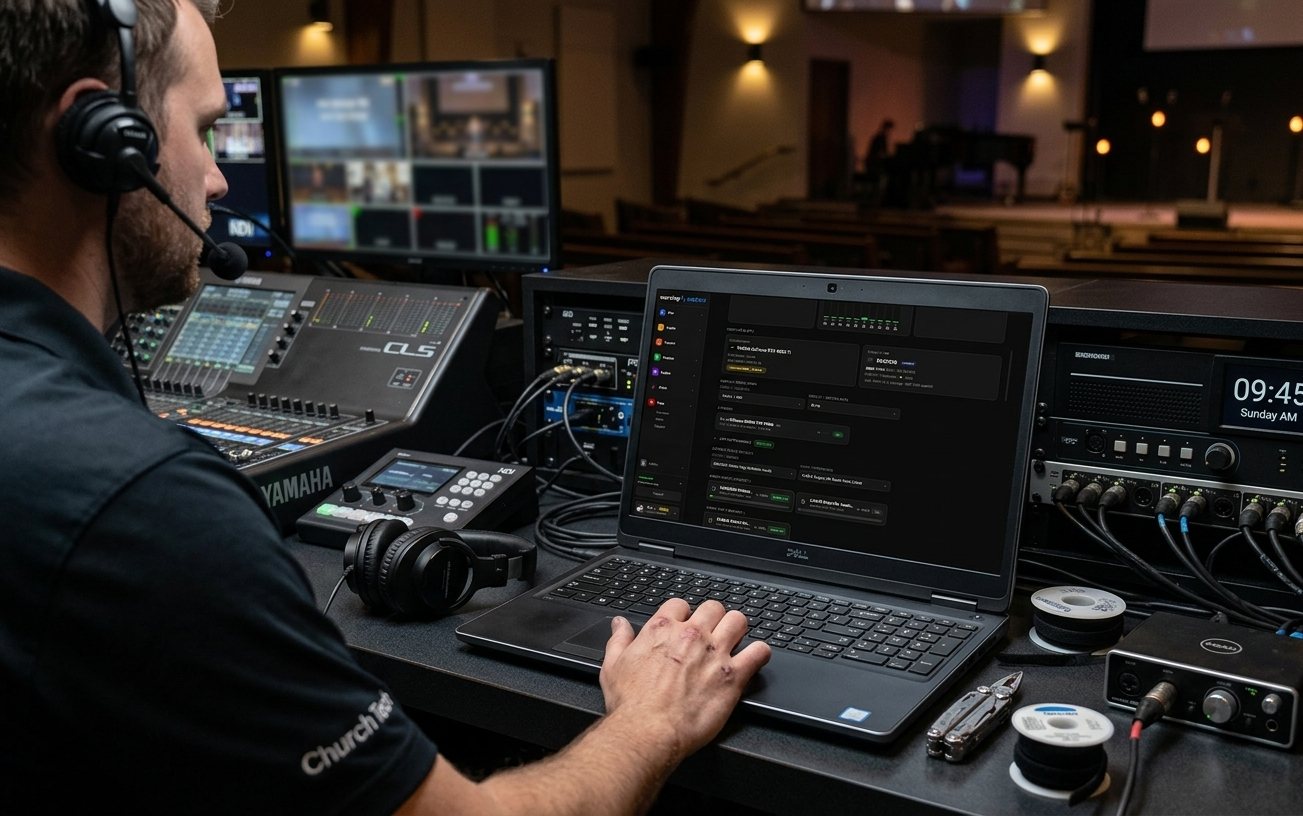
Most church AV teams verify their setup by walking around the booth and checking each device one at a time. AV Monitoring surfaces the status of every connected camera, switcher, encoder, and integration in a single dashboard that updates in real time.
- Real-time stream bitrate, resolution, and frame drop monitoring
- Device connectivity status for cameras, switchers, and encoders
- Historical health data so you can spot patterns across Sundays
- Alerts when stream quality degrades below thresholds you set
- A device catalog of 422 ProAV models with factory port maps for monitoring setup
- A live Alerts feed — device offline, resource criticals, stream drops — with full history
- Service Metrics that tie system health to each individual service
- One dashboard that replaces the pile of separate monitoring tools
Inside every machine
Open any machine. See everything.
Every PC running Tech Manager gets its own live page in Pulse — seconds-fresh, readable from anywhere, and deep enough to answer the question that matters most on a Sunday: is it the computer, or isn't it?
Processor & memory
Is the machine struggling? Answer from anywhere.
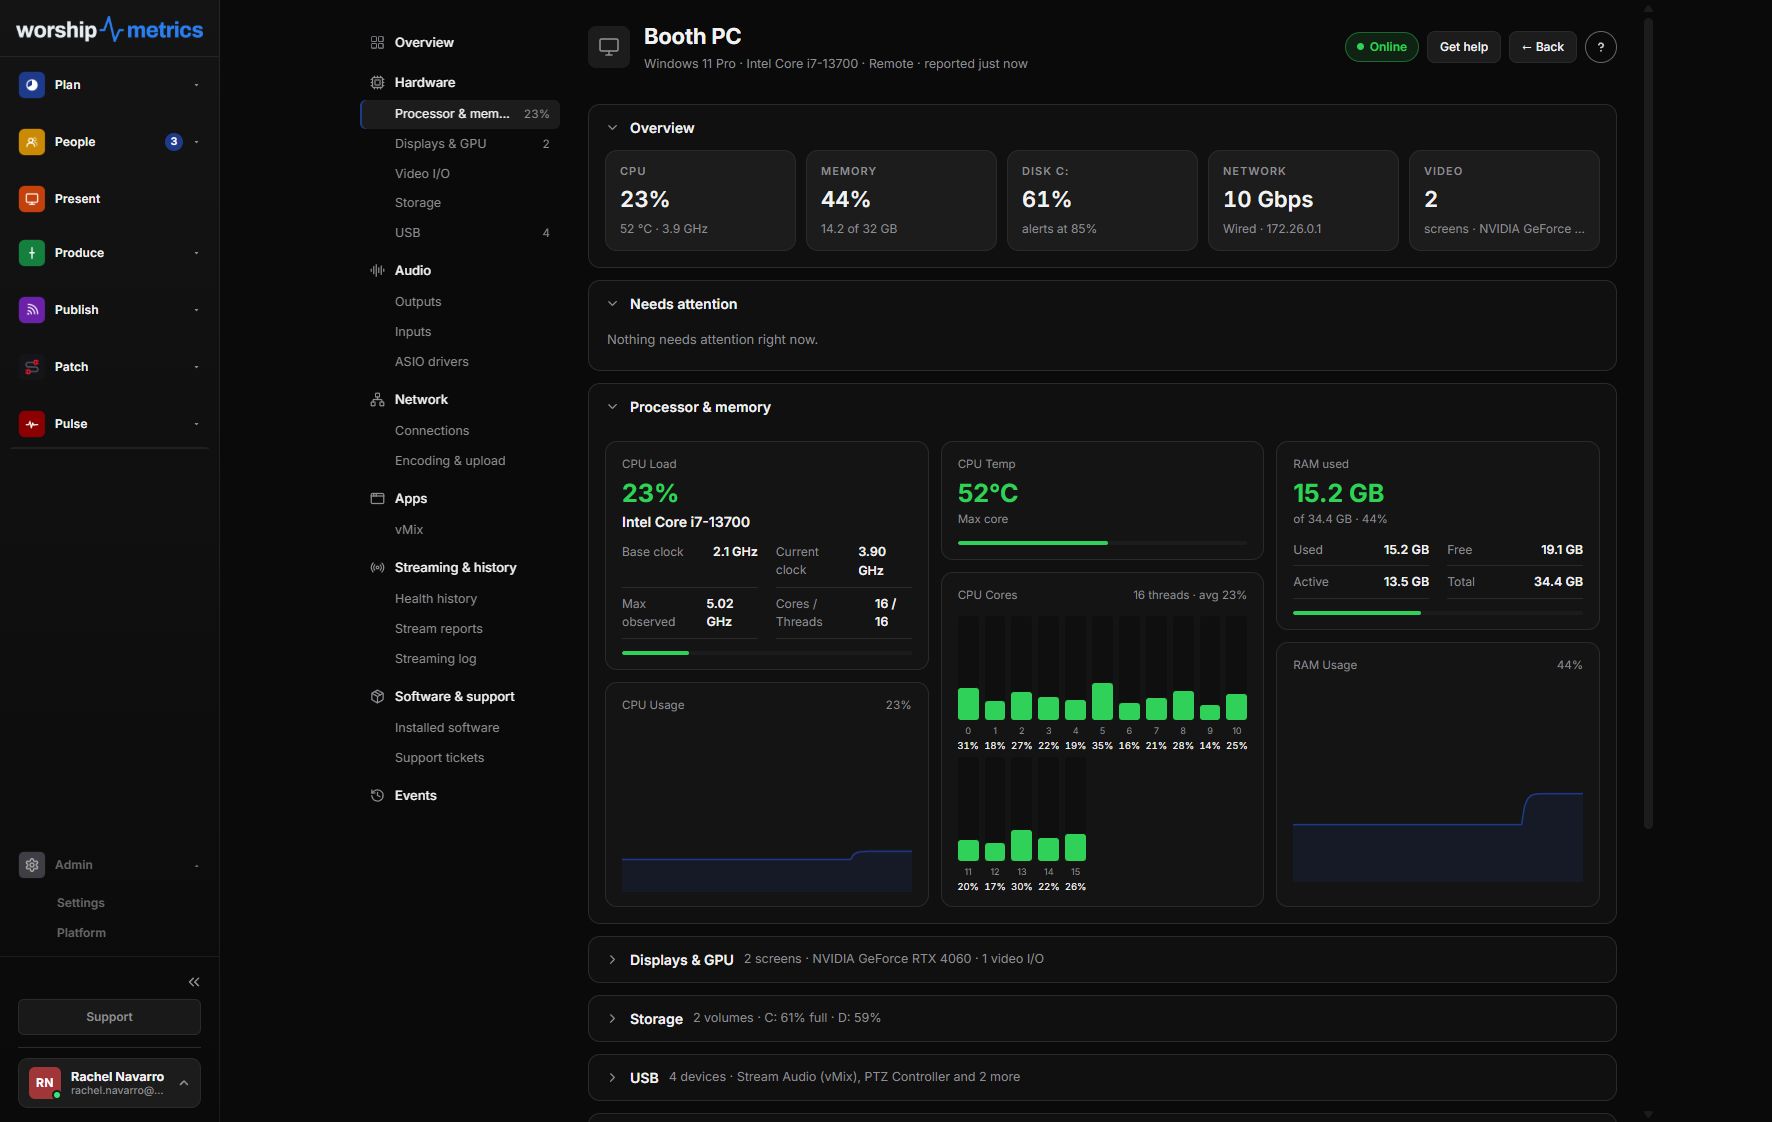
CPU load with a bar for every core, base and current clocks, temperature, and RAM used against installed — with live graphs, the machine's uptime, and how many seconds ago it last reported. When Present stutters or the stream drops frames, this page says whether the computer is the problem before anyone walks to the booth.
Displays, GPU & audio
See the graphics card. Set the resolution. Pick the sound card.
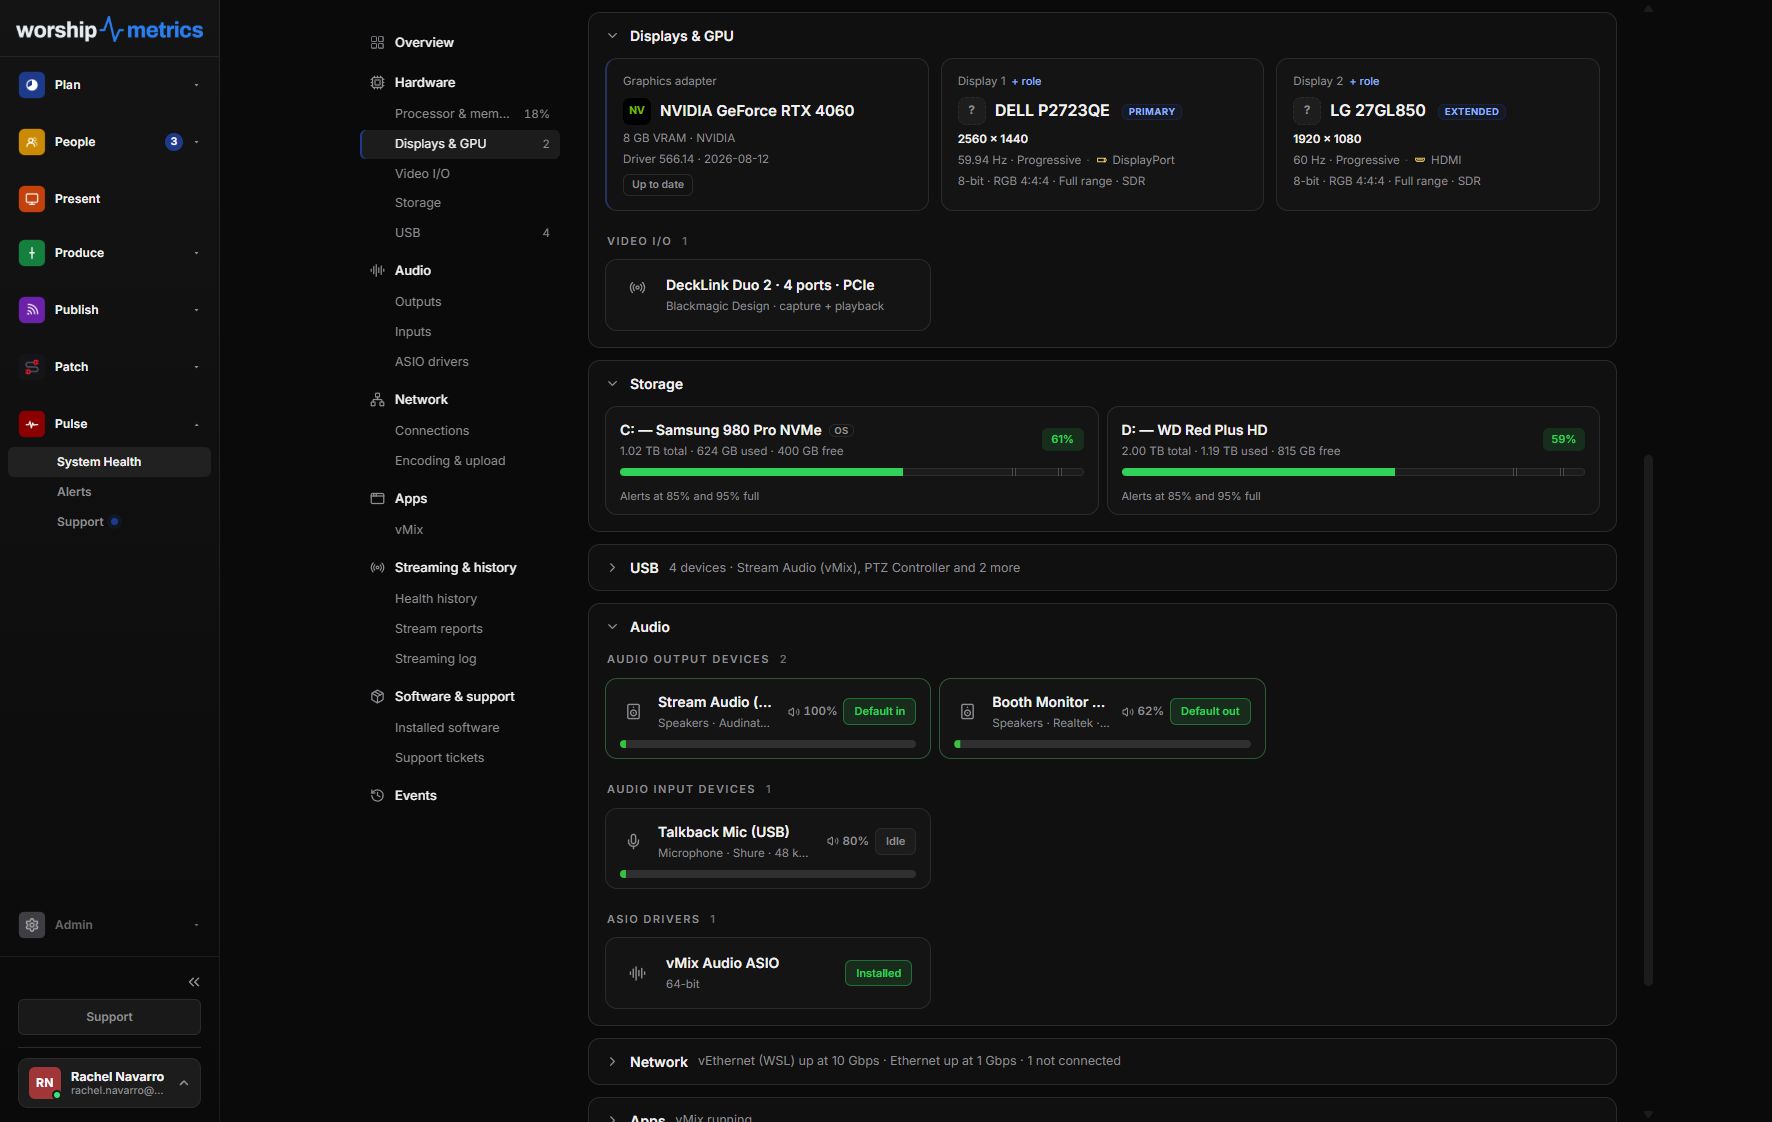
The GPU with its VRAM and driver version — checked daily, with an update chip the moment a newer driver ships. Every display with its resolution, refresh rate, and connection — and the resolution dropdown actually changes it, remotely. Default audio output and input are pickable from the same page, storage shows the actual drive model and free space, and every remote change lands in the machine's history.
USB peripherals & network
The unplugged-mouse problem, caught before Sunday finds it.
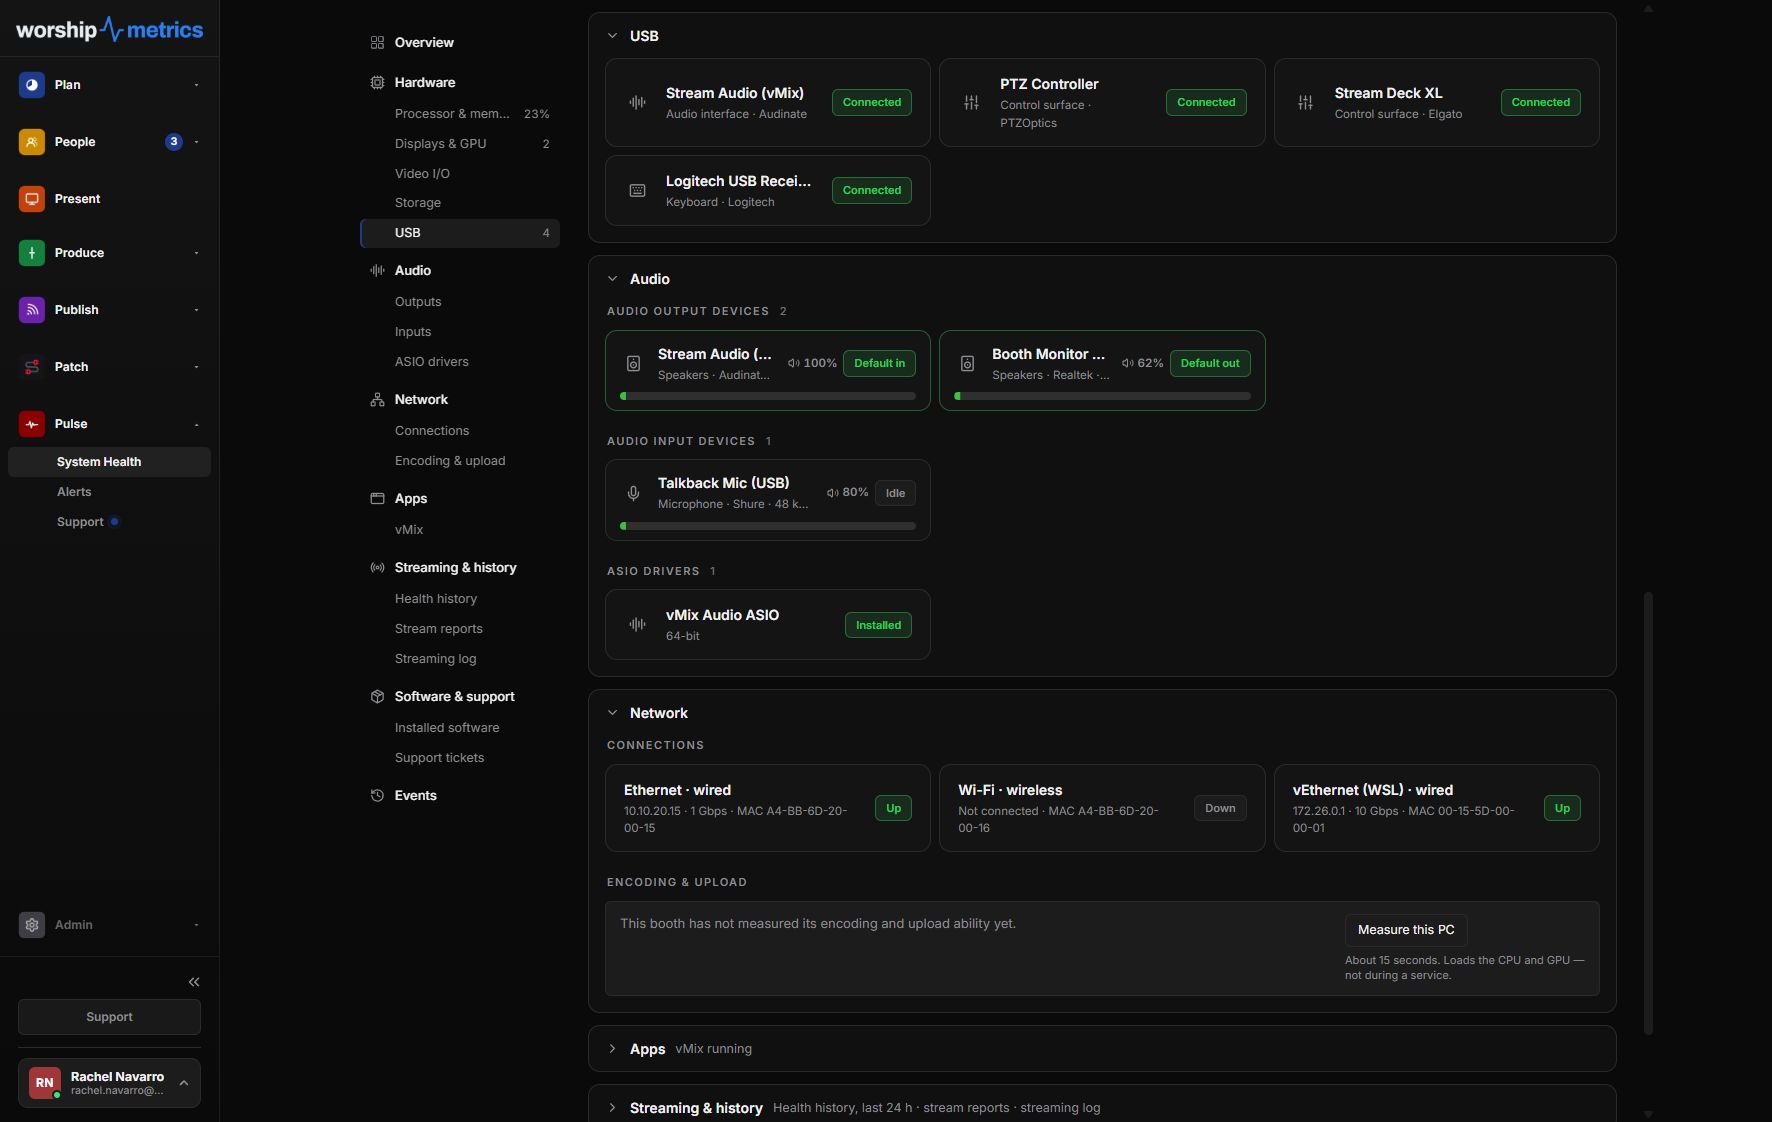
Every USB device, named for what it is — the keyboard, the mouse, the control surface, even the printer — beside every audio device with volume, mute state, and sample rate, and every network connection with its IP and link speed. When a mouse wanders off to another ministry or a keyboard cable gets knocked loose, Tech Manager logs the disconnect the moment it happens, by name, into the machine's event feed and your org-wide incident history. A thirty-second fix stops hiding until fifteen minutes before the service.
Where the problems go
Most issues never reach a human. That's the point.
Monitoring isn't there to give your team more alerts to read — it's there to make most problems disappear before Sunday, and to hand the rest to someone who already knows what happened.
When Pulse sees it, support already knows
Monitoring and tech support are one system.
Everything Pulse watches flows straight into support. Call 910-WORSHIP or open a chat, and the AI is already looking at the same live telemetry your dashboard shows — every device, every alert, the health history leading up to the problem, and the last week of hardware changes, that unplugged USB cable included. No re-explaining, no starting from scratch.
Prove your AV is serving the mission
Data that helps you make the case for better gear.
When you can show leadership that your stream dropped three times last month and attendance dipped on those same Sundays, the conversation changes. AV Monitoring gives you the data to justify upgrades, plan installs, and prove that your AV investment is serving the mission.
- Historical stream health data across weeks and months
- Correlate technical issues with attendance and engagement trends
- Build a data-backed case for equipment upgrades and system improvements
- Show your leadership what your team is managing every Sunday
How it works
Three ways to keep eyes on your system.
Real-time
Watch stream bitrate, frame drops, and device status during the service. Red flags surface before they become visible problems.
Pre-service
Run a health check before the room fills up. Confirm every camera, encoder, and integration is connected and reporting.
Historical
Review stream performance across Sundays. Spot patterns, correlate issues with attendance dips, and plan maintenance windows.
Attendance + stream health together
See how your stream quality actually affects who shows up.
Most churches track attendance and stream quality in two completely separate tools. WorshipMetrics brings them together so you can see the real relationship between technical quality and online engagement.
Know before they text you.
Stop finding out about stream problems from the people watching at home. Monitor your system health, protect your online reach, and walk into Monday with real data about how Sunday actually went.
Technical details
For the person who reads the spec sheet.
Telemetry cadence
Light heartbeat every 15 s over an encrypted WebSocket (HTTPS fallback), full hardware snapshot every 60 s, adaptive on-machine polling between beats
Offline thresholds
Online badge flips after 90 s (three missed beats); alert email after 5 minutes of silence; a dropped connection is caught in ~60 s; signage screens alert at 30 minutes
Resource red lines
CPU ≥ 90%, RAM ≥ 90%, disk ≤ 5% free, CPU temp ≥ 95°C — with hysteresis recovery (85% / 85% / 8% / 92°C) and a 30-minute re-alert cooldown per machine
Alert types
Device offline, AV device offline, resource critical, audio state, and livestream drop — three severities across six filterable areas (Hardware, System, Stream, Audio, Network, Other)
Delivery channels
Email, text message (for anyone who opts in), desktop notifications on the booth computer, in-app feed, and live page updates
Machine telemetry
CPU load/temp/clocks, RAM, per-disk storage with drive model, GPU and driver version, displays (resolution, refresh, HDR, rotation), audio endpoints, USB peripherals, network adapters and WiFi signal
Stream telemetry
Bitrate vs target, dropped-frame %, encoder load, fps, scene, resolution, reconnect count — plus upload/download, latency, jitter, packet loss, and audio silence/clipping flags
AV device health
Multi-observer rollup with online / degraded / stale / offline / unknown states — offline requires every fresh observer to agree, so one bad network path never false-alarms
Anti-spam mechanics
One alert per outage by atomic claim, re-armed on recovery; hysteresis margins, per-machine cooldowns, and fan-out caps keep a flapping device to a single page
Software inventory
Hourly software and driver collection from the system registry, with graphics-driver currency checked daily
History retention
Alert history 90 days, device metrics 30 days, observations and timeline non-events 7 days
Attendance counting
Seat-map counter with reusable templates (sections, rows, member-assignable seats) and camera auto-count from RTSP or webcam — schedulable, or triggered remotely from the web
Notifications
The night before, your inbox already knows.
Pulse doesn't wait to be checked. It flags problems 30 minutes before service, plus a ready-for-tomorrow email the evening before your first service — and if a device goes quiet overnight, the message says so and suggests coming in early. Email is included on every plan; add text message alerts for anyone who opts in. And when a stream or recording drops mid-service, Self Healing puts a one-tap restart in the same alert.
Connected through the cloud
Watched from anywhere. Fixed from anywhere.
From the Knowledge Base
Monitoring questions churches actually ask.
Modernize your AV · Instant tech support
Download Tech Manager free — and put a tech support number in the booth.
Tech Manager connects your church's AV system to WorshipMetrics: documented, monitored around the clock while it runs (it starts with the computer), and backed by a number your team can call the moment anything acts up. Our AI support sees your actual system — so issues get solved before frustration starts.
New to us? Call and we'll put you in touch with the team. How phone support works →
Tech support, any time
910-WORSHIP(910) 967-7447
AI phone support any hour on Pro and Max · a person on the line with Care or Sunday Assurance.