The short answer: something is running out — slowly
A stream that’s broken from the first minute has an obvious cause. A stream that starts clean and falls apart forty minutes in has a cumulative one: some resource that was fine at 9:00 is being consumed, warmed, or crowded as the service runs. There are four usual suspects, and they leave different fingerprints:
- Memory pressure building on the booth PC — the most common story.
- Heat pushing the CPU toward throttle territory.
- Disk space shrinking as the recording grows.
- Network congestion peaking as the building fills with phones.
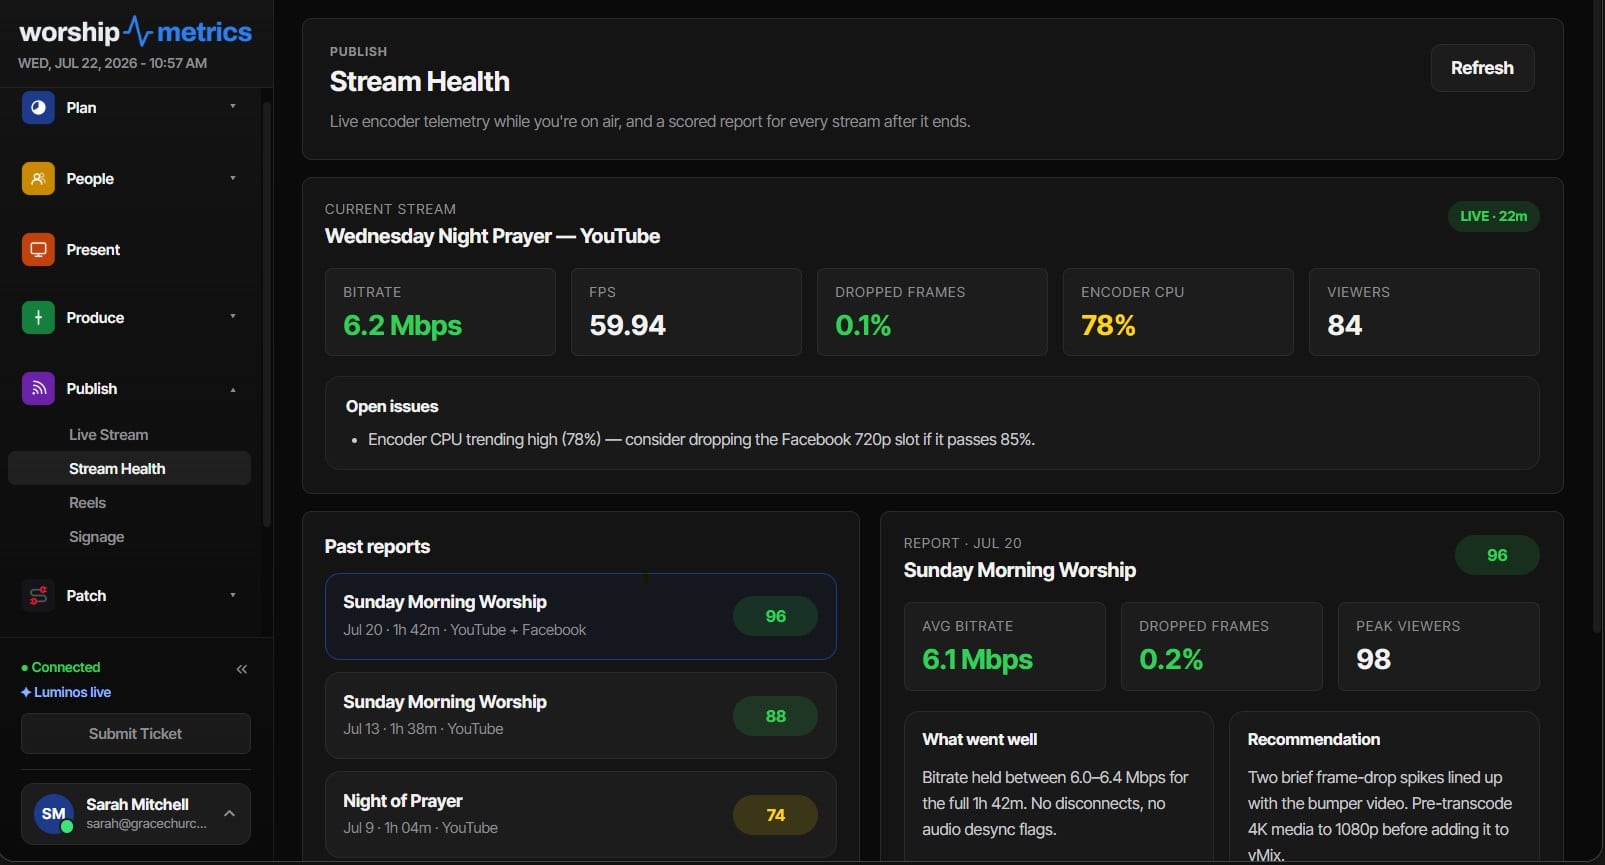
The reason this fault is so maddening to chase by hand is that whoever checks the machine after the service finds it idle, cool, and innocent-looking. The diagnosis lives in what was happening at 9:40, which is exactly what continuous telemetry is for — the Tech Manager booth app samples the encoder and the machine every five seconds all service long, so the slide is recorded even though nobody was watching for it.
Here’s each suspect, its fingerprint, and its fix.
Suspect 1: memory creep — fine at 9:00, paging by 9:40
Memory pressure causes the slow, creeping degradation that’s hardest to spot live. As the service runs, RAM fills — the encoder’s buffers, a browser someone left open with fifteen tabs, a chat app quietly caching — and when the operating system starts paging to disk, “a little slow” becomes stutter on a machine that’s also encoding video.
The fingerprint: RAM climbing steadily across the service in the telemetry, with stutter arriving as it crosses into the 90s. Pulse trips a critical resource alert at 90% RAM precisely because that’s where paging begins — the published thresholds exist so this fires before the congregation notices.
The fix: a pre-service restart of the booth PC (fresh boot, fresh memory), a close-everything discipline for non-production software, and — if the creep persists on a clean machine — more RAM. This is the cheapest hardware upgrade that fixes a Sunday problem.
Suspect 2: heat — the machine that throttles at the sermon
CPUs protect themselves from overheating by slowing down, and a booth PC in a sealed cabinet, choked with dust, or running a tired fan warms steadily from the moment the encoder starts. Forty minutes in, it crosses into throttle territory and the encoder — which was using most of the CPU already — suddenly has less machine underneath it.
The fingerprint: CPU temperature climbing all service and encoder load rising with it; the alert line is 95°C, which is throttle territory for nearly every modern CPU. The fix is physical and weekday-shaped: dust, airflow, an open cabinet, a working fan — all fixable on a Tuesday, none at 9:58.
Suspect 3: the disk the recording is eating
Local recordings consume gigabytes per hour, and a disk that crosses into its last few percent mid-service can take the recording — and sometimes the encoder — down with it. The fingerprint: free space shrinking linearly all morning. The safety net: Tech Manager reports free space continuously, and Pulse raises a critical alert at 5% free so a human addresses the trend before it takes a recording down. The fix: a storage plan — archive old recordings on a schedule instead of discovering the problem at 9:40.
Suspect 4: the building woke up
Sometimes the machine is innocent and the network changed: at 9:00 you shared the internet with a locked building; by 9:40 you share it with every phone in the sanctuary. Uplink congestion shows up as bitrate sagging from target and dropped frames climbing — often in a tell-tale dip during greeting time, when the lobby WiFi lights up.
The fingerprint: the machine’s own vitals staying flat while bitrate wobbles and dropped frames spike — instability with clean system numbers is a network story, not a computer story. The fix: wire the encoder, right-size the bitrate to half your Sunday-morning measured upload, and separate streaming traffic from guest WiFi — the full triage is in is our church WiFi good enough to livestream? and the church network guide.
Why averages hide this — and five-second samples don’t
A per-service average would tell you a 9:40-stutter Sunday was “mostly fine” — because it was mostly fine. Five-second resolution is what separates a bitrate that sagged for ninety seconds during greeting time from one that was low all morning, and a RAM line that climbed all service from one that spiked once. That’s the design premise of the stream health score: every service produces a 0-100 report with the full telemetry timeline, each penalty timestamped, and a plain-English recommendation attached.
The report matters over weeks, not just Sundays. One bad morning is an event; a slow slide across a month is drift — a machine accumulating background software, a disk filling, a network getting busier — and drift is the pattern human memory misses and telemetry catches. If the same deduction appears three weeks running, you’ve found a project, not a fluke.
How WorshipMetrics handles this
The 9:40 mystery is exactly what the platform’s telemetry was built to solve: Tech Manager samples CPU, RAM, temperature, disk, and encoder state every five seconds; Pulse trips its published thresholds before the congregation notices and pushes the alert to your phone; Self Healing offers a one-tap restart the instant the stream or recording stops; and every service’s health report turns “it got weird near the end” into a timestamped, diagnosable timeline. The machine knows why it stuttered at 9:40. Now you get to know too.
Related questions
- Why does the stream degrade gradually instead of just failing?
- Because the causes are cumulative: memory pressure builds as the service runs, CPU temperature climbs toward throttle territory, disk space shrinks as the recording grows, and network congestion peaks when the building fills. Each one erodes headroom slowly — which is why the stream was genuinely fine at 9:00.
- How do I find out which cause is mine?
- Look at telemetry over time, not a single reading. WorshipMetrics samples the encoder and the booth machine every five seconds all service long, so the health report shows exactly when the slide began and which measurement moved first — RAM, CPU, temperature, bitrate, or dropped frames.
- What's the fastest fix to try this Sunday?
- Restart the booth PC before the service and close everything that isn't production software — a fresh boot resets the memory creep that causes most 40-minutes-in stutter. Then let the health report tell you whether the real story is memory, heat, disk, or network.
How Do Churches Know How Many People Actually Watched the Livestream?
NextWhat Counts as Attendance When Half the Congregation Watches Online?
Related Articles
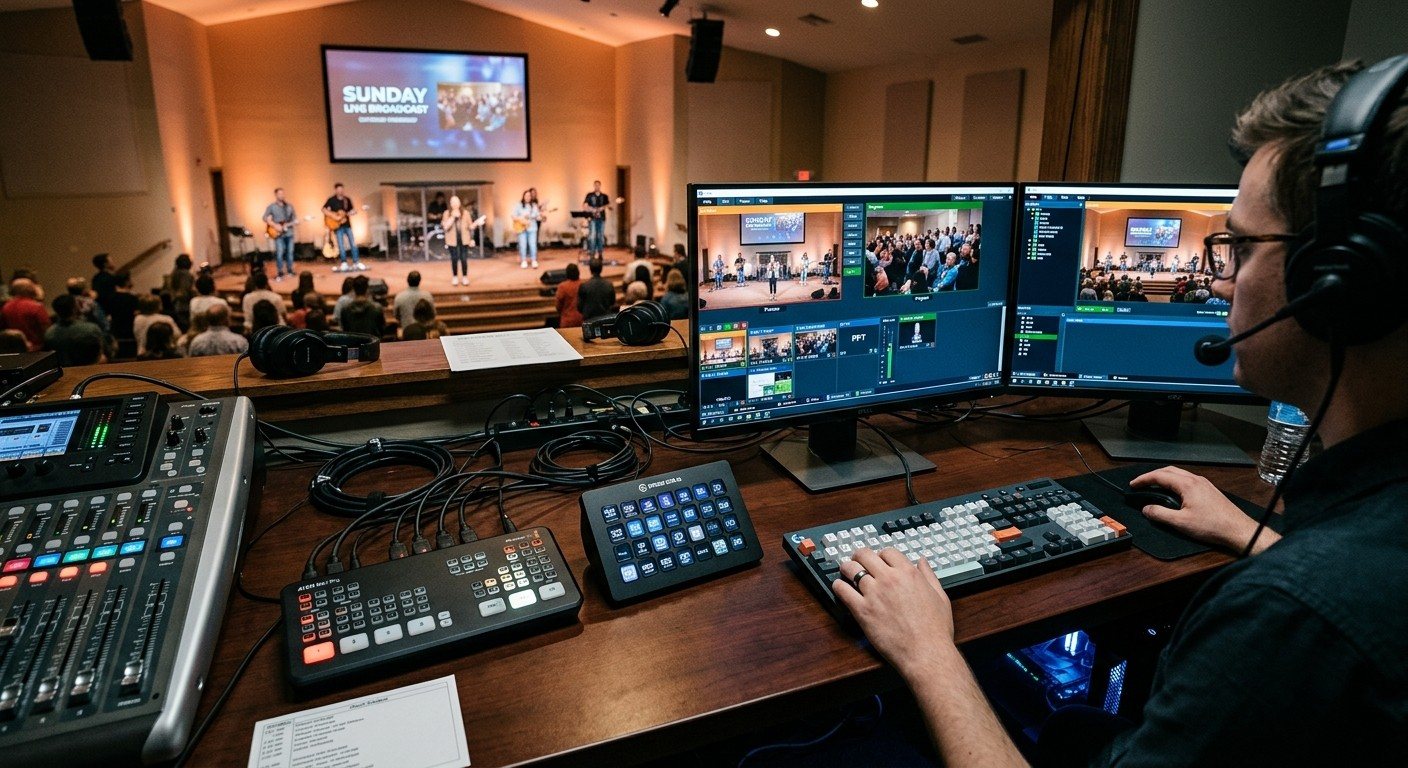
Bitfocus Companion + ATEM Mini: A Stream Deck Panel for Your Church Switcher
A Stream Deck running Bitfocus Companion turns a Blackmagic ATEM into plain-word buttons with colors that show what's live, and the same panel can run PTZ cameras, projectors, and more. Here's how to connect Companion to an ATEM and build a volunteer page.
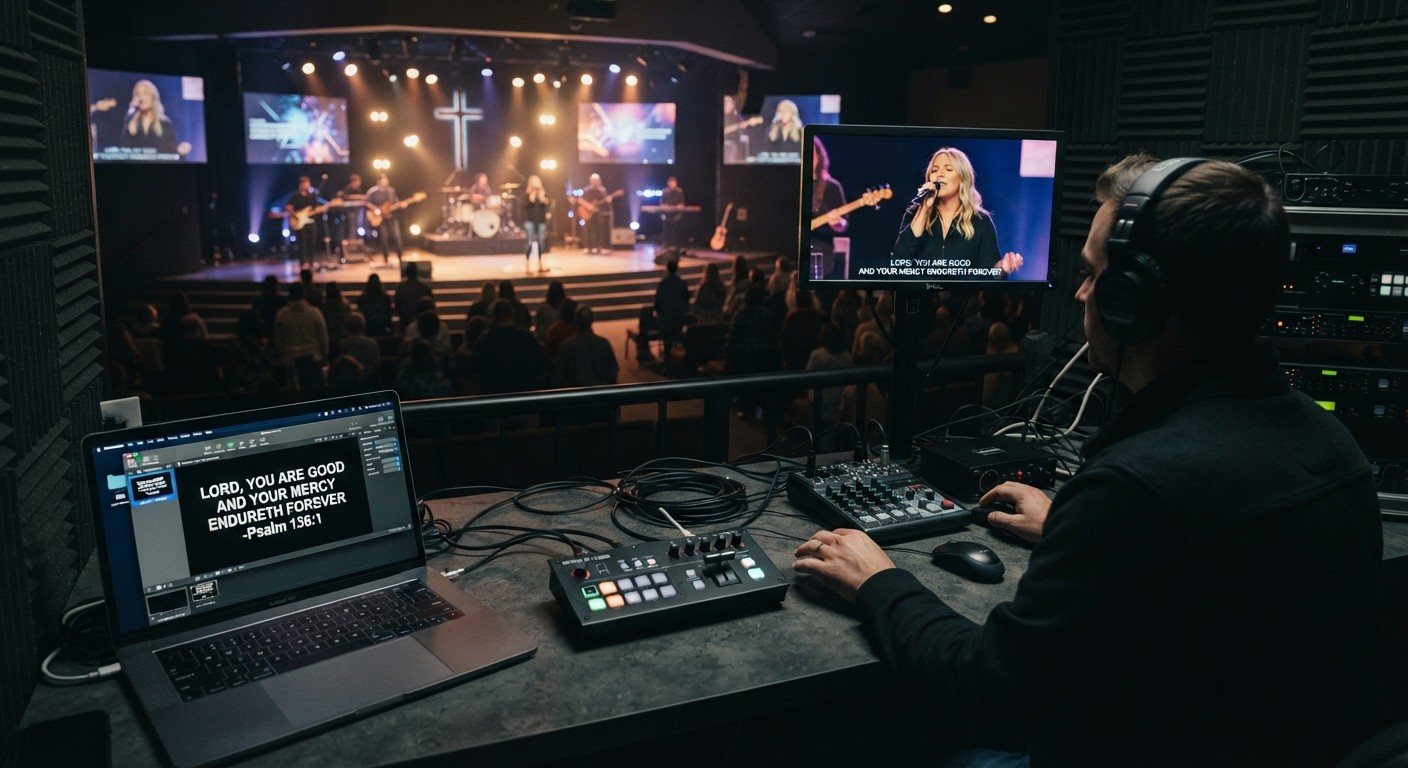
Lyrics Over the Camera on an ATEM Mini: Luma Keys, Chroma Keys, and the Slides Computer
To put song lyrics over the camera shot on a Blackmagic ATEM Mini, feed the slides computer into an ATEM input and key it over the camera. Here's how luma and chroma keys work for lyrics, how to design slides that key cleanly, and who should run it.
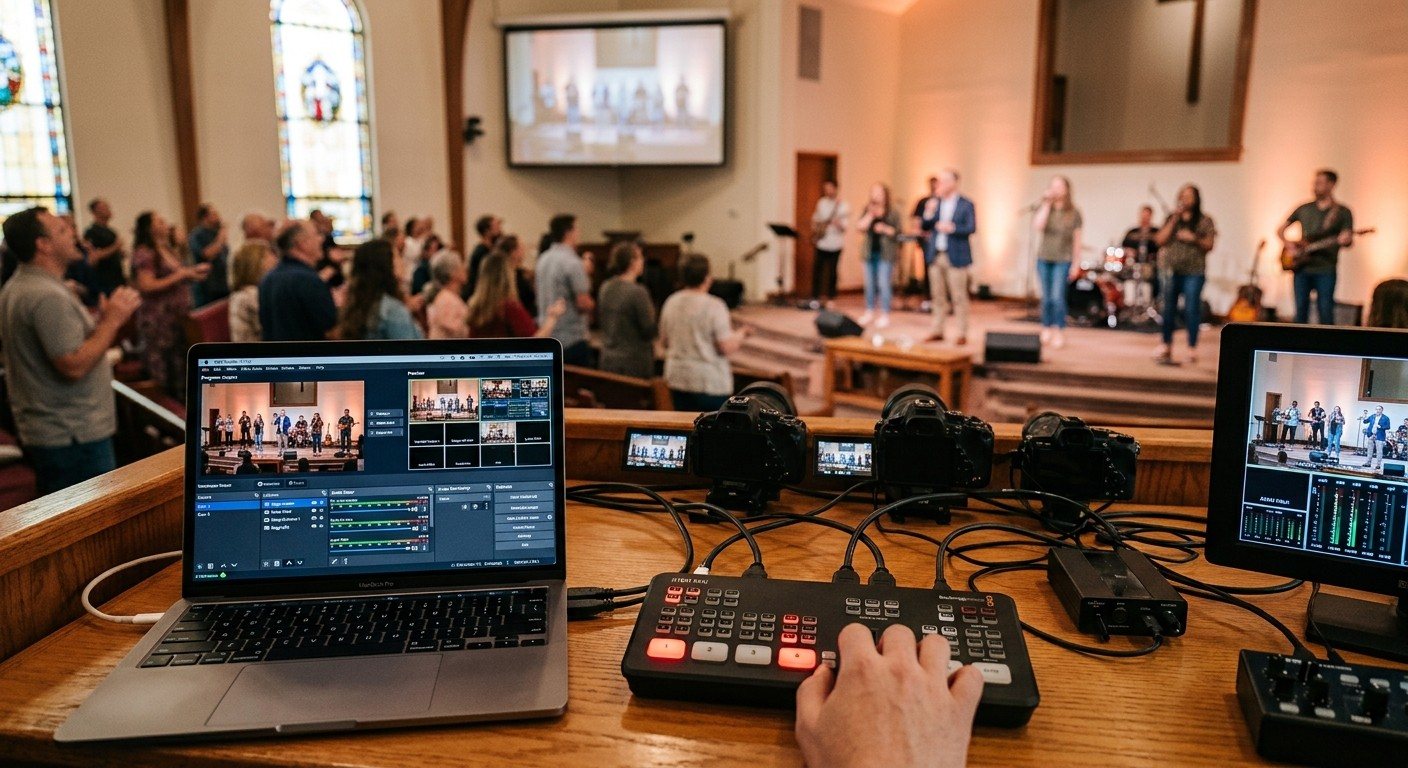
ATEM Mini + OBS for Church: Hardware Camera Switching with OBS for Graphics and Streaming
Many churches use an ATEM Mini as a camera switcher and send its output into OBS over USB as a webcam. The ATEM gives volunteers real buttons; OBS adds lyrics, graphics, recording, and streaming. Here's how to set it up, split the jobs, and avoid the common sync and quality problems.