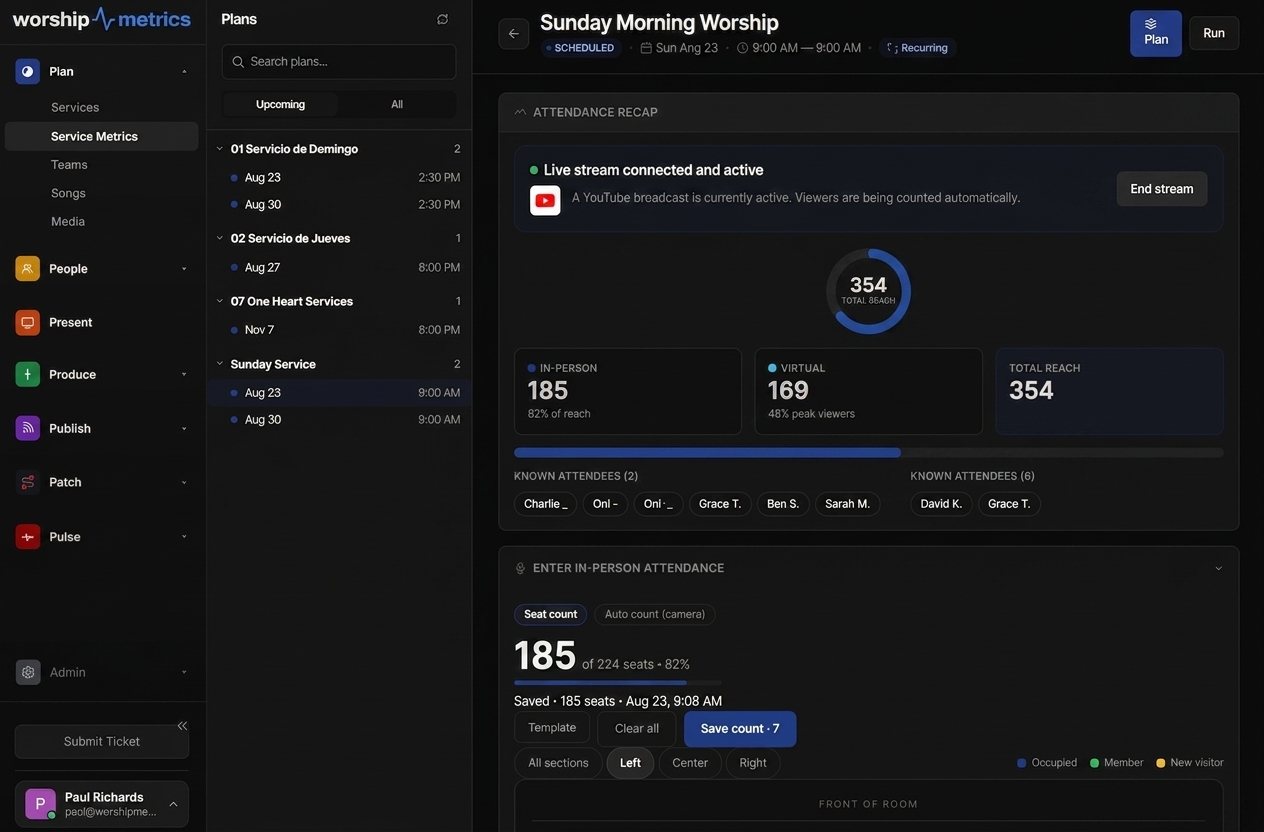
The short answer: count concurrent viewers during the live window, automatically
The honest measure of an online congregation is how many screens were watching while the service was live — and if your broadcast is connected to WorshipMetrics, that number takes care of itself. Concurrent viewers on a connected YouTube or Facebook broadcast are sampled every minute, during and after the service, and when the broadcast ends the peak and average roll into that day’s attendance record automatically. Streams through the WorshipMetrics player count the same way. Nobody writes anything down.
That’s the mechanics. The more interesting question is why the number your platform shows you by default — “views” — isn’t the one to report to leadership, and what a trustworthy weekly measure actually looks like.
Why “1,200 views” doesn’t mean 1,200 worshipers
Every streaming platform reports views, and every platform means something slightly different by it. View counts accumulate over days and weeks; they mix live watchers with replay watchers; they include the person who watched for a few seconds while scrolling, and they can count the same person several times across devices and visits. None of that makes the number dishonest — it’s just answering a different question. “Views” measures content reach over time. It doesn’t measure who worshiped with you on Sunday.
Concurrent viewers — how many connections were watching at once, at a given minute — is the metric that behaves like attendance. It has a shape across the service (climbing through the first songs, peaking mid-sermon), it has a peak, and it has an average. When a leader asks “how many people were with us online?”, peak concurrent is the defensible answer, with the average alongside it as the steadier week-to-week signal.
The minute-by-minute sampling matters more than it first appears. A single end-of-service number can’t tell you when people joined or left; a per-minute curve can. If online viewers consistently arrive fifteen minutes late, that’s a real insight about your online congregation’s habits — and it’s invisible in any single total.
One record per service, next to the in-room count
The viewer numbers don’t land in a silo. Each service’s recap in Service Metrics pairs the online figures with the in-person count — from the seat-map counter or camera Auto-Count — plus the broadcast comments that came in during the stream. Together they produce Total Reach: one number for everyone who worshiped with you, with the in-room and online halves always visible separately.
Keeping the halves separate is the part leaders come to rely on. A flat total can hide a real story — in-room dipping over the summer while online quietly grows, or the reverse. The shape of the congregation matters as much as its size, and you only see shape when the streams are counted distinctly. For the leadership view of all this — the Monday-morning dashboard, health score included — see how a pastor checks that Sunday went okay.
Consistency is what makes the number mean something
An attendance metric earns trust the same way a bathroom scale does: by measuring the same way every time. Automatic counting is what delivers that consistency — the sampling happens every minute of every broadcast, whether the tech booth had a calm morning or a chaotic one, whether the volunteer remembered or didn’t.
That consistency is also what makes comparisons legitimate. Attendance Over Time charts in-person, virtual, and total by month, quarter, or year, with each service type broken out separately — so “Easter versus last Easter” and “is the online congregation growing or stagnant?” are answered from identically measured data, not from a mix of hand-recorded guesses and platform screenshots.
One practical note on plans: in-person counting ships in the free platform (camera Auto-Count comes with Pro and Max), and automatic online viewer analytics comes with the Max plan — see pricing for the full picture.
What the numbers are ultimately for
It’s worth ending where the counting should end: the people. The online congregation isn’t an abstraction — it’s the homebound member who never misses a Sunday, the family that moved three states away, and the not-yet-visitor quietly deciding whether your church is safe to walk into. Counting them accurately is the first step in treating them as the congregation they already are; connecting those attendance signals to follow-up workflows is the second.
How WorshipMetrics handles this
Online attendance in WorshipMetrics is automatic by design: connect your YouTube or Facebook broadcast and live streaming samples concurrent viewers every minute, rolling peak and average into the service’s record when the broadcast ends — right beside the in-room count in Service Metrics, where Total Reach and the year-over-year charts live. The stream your team already produces becomes the attendance data your leadership already wanted, with nobody transcribing anything on Monday.
Related questions
- Why is my YouTube view count so different from my live viewer count?
- Platform view counts accumulate everything — replays, partial watches, and people who clicked away in seconds — over days or weeks. Concurrent viewers during the live window measures how many screens were actually watching while your congregation worshiped, which is the number that compares meaningfully to the people in the room.
- Do I have to write down viewer numbers after every service?
- Not if your broadcast is connected. WorshipMetrics samples concurrent viewers every minute during a connected YouTube or Facebook broadcast, and rolls the peak and average into that day's attendance automatically when the broadcast ends. Streams through the WorshipMetrics player count the same way.
- Can we see whether online viewership is growing over time?
- Yes — because every service stores its numbers the same way, Attendance Over Time charts in-person, virtual, and total by month, quarter, or year, broken out by service type. Easter versus last Easter, this series versus the last one.
Is Our Church WiFi Good Enough to Livestream?
NextWhy Does Our Livestream Look Fine at 9:00 and Stutter by 9:40?
Related Articles
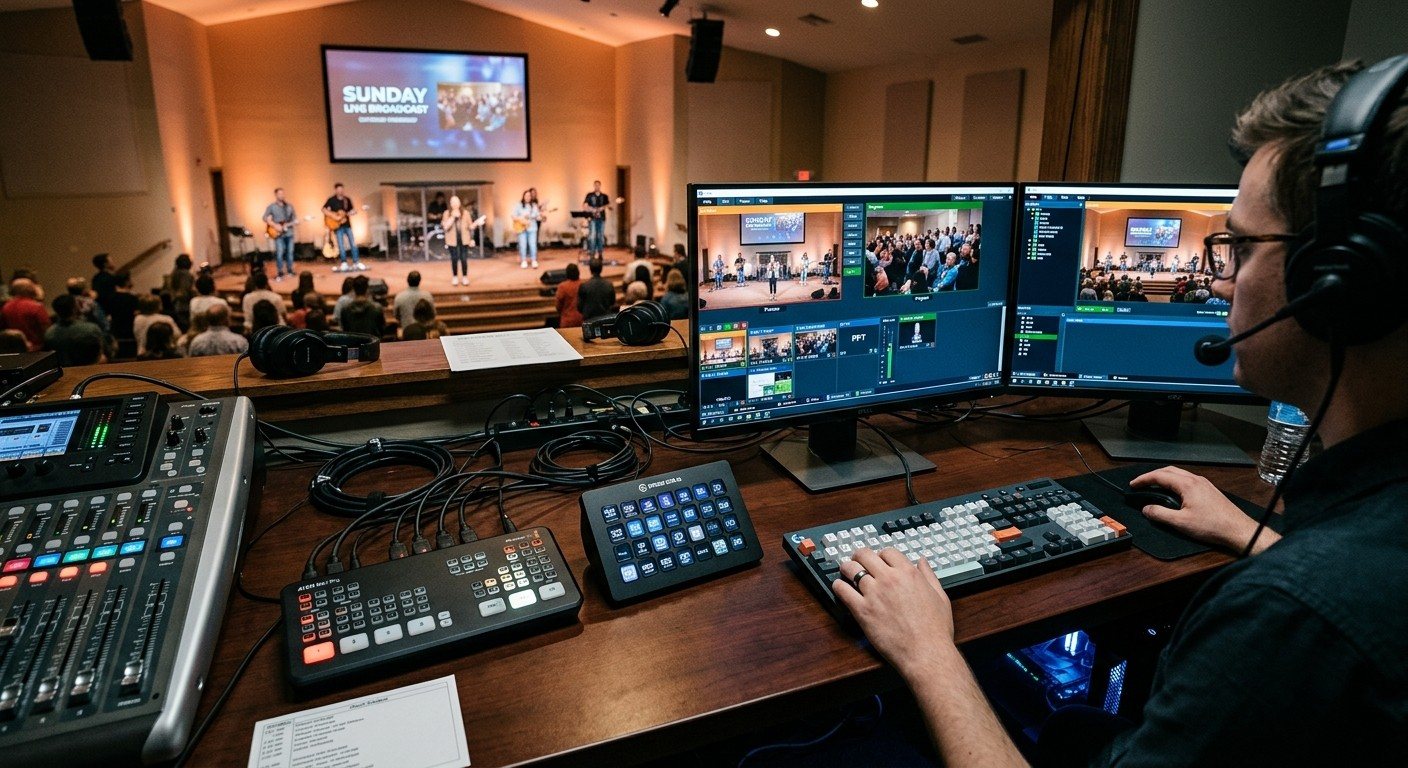
Bitfocus Companion + ATEM Mini: A Stream Deck Panel for Your Church Switcher
A Stream Deck running Bitfocus Companion turns a Blackmagic ATEM into plain-word buttons with colors that show what's live, and the same panel can run PTZ cameras, projectors, and more. Here's how to connect Companion to an ATEM and build a volunteer page.
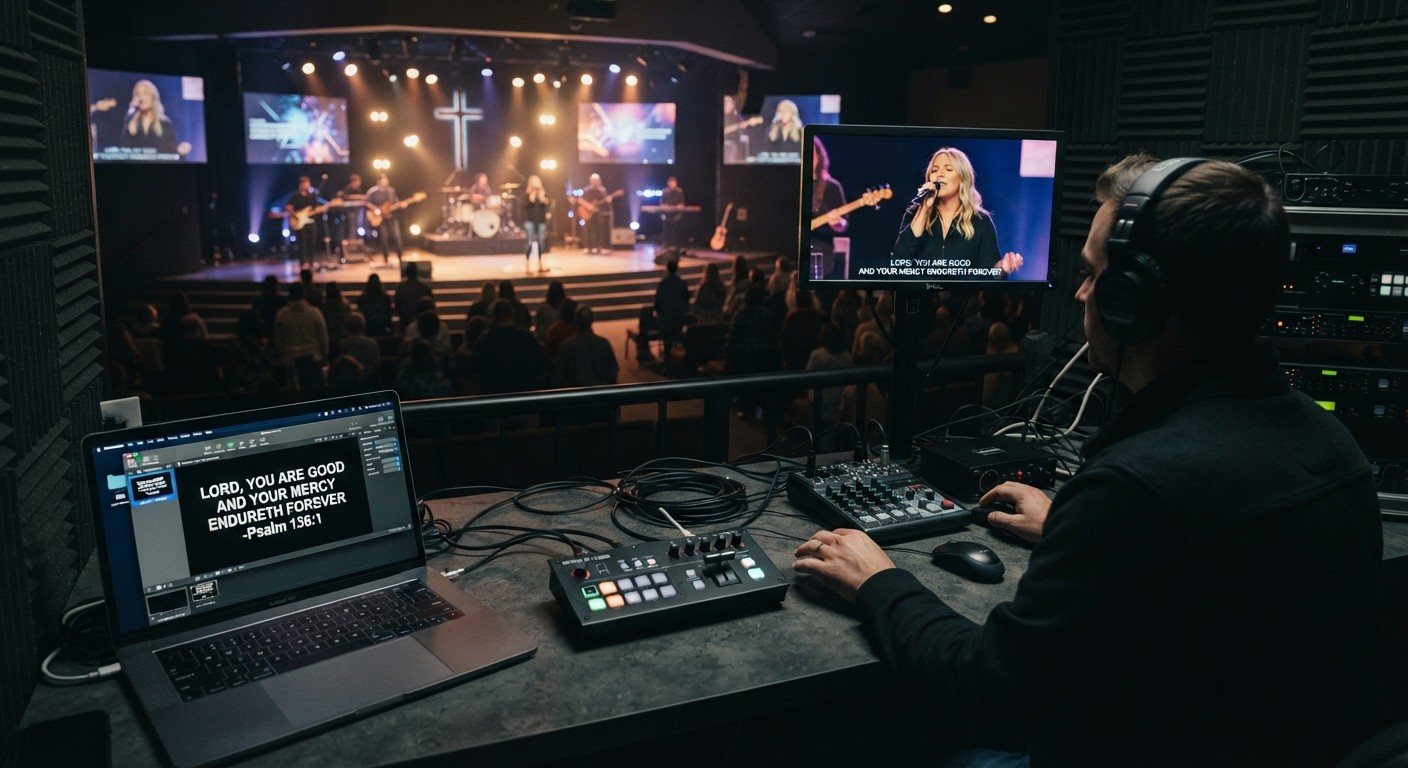
Lyrics Over the Camera on an ATEM Mini: Luma Keys, Chroma Keys, and the Slides Computer
To put song lyrics over the camera shot on a Blackmagic ATEM Mini, feed the slides computer into an ATEM input and key it over the camera. Here's how luma and chroma keys work for lyrics, how to design slides that key cleanly, and who should run it.
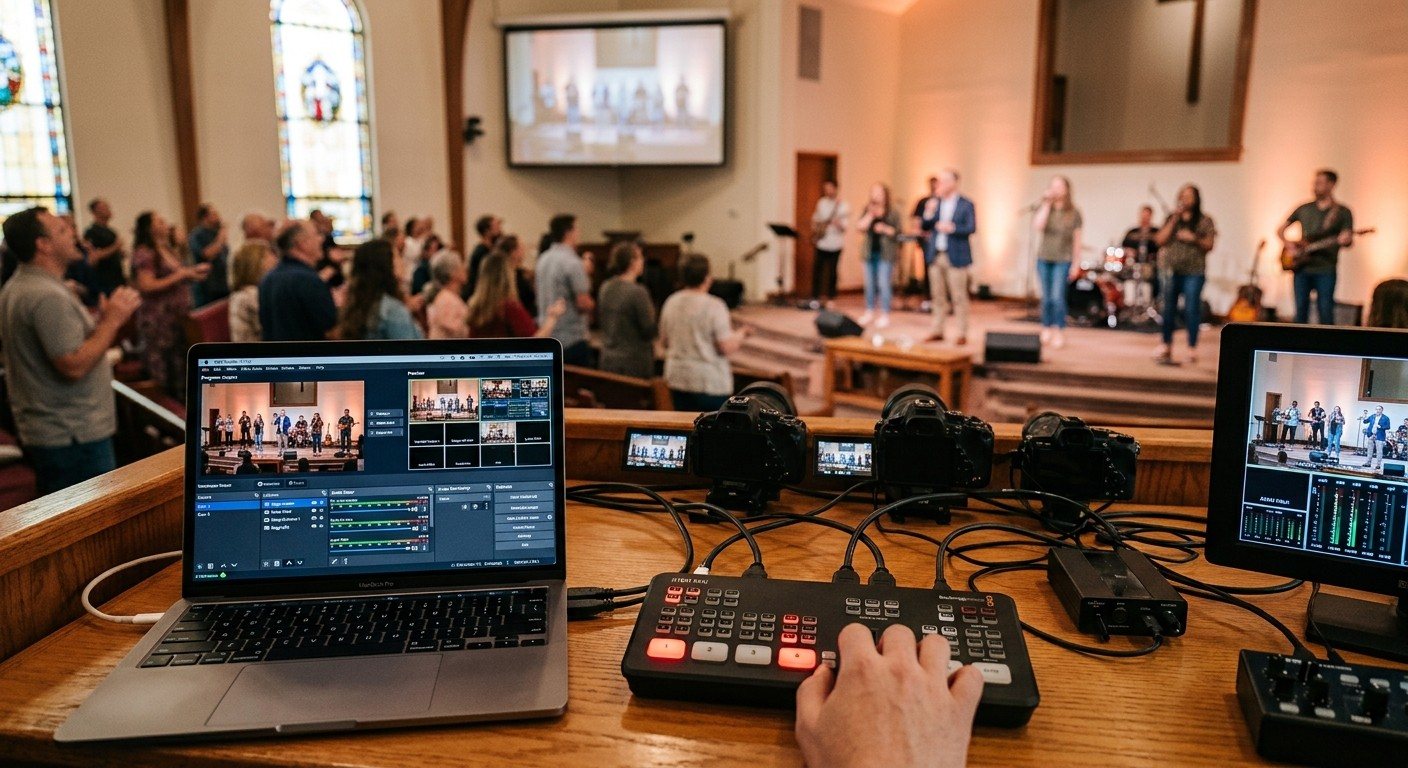
ATEM Mini + OBS for Church: Hardware Camera Switching with OBS for Graphics and Streaming
Many churches use an ATEM Mini as a camera switcher and send its output into OBS over USB as a webcam. The ATEM gives volunteers real buttons; OBS adds lyrics, graphics, recording, and streaming. Here's how to set it up, split the jobs, and avoid the common sync and quality problems.