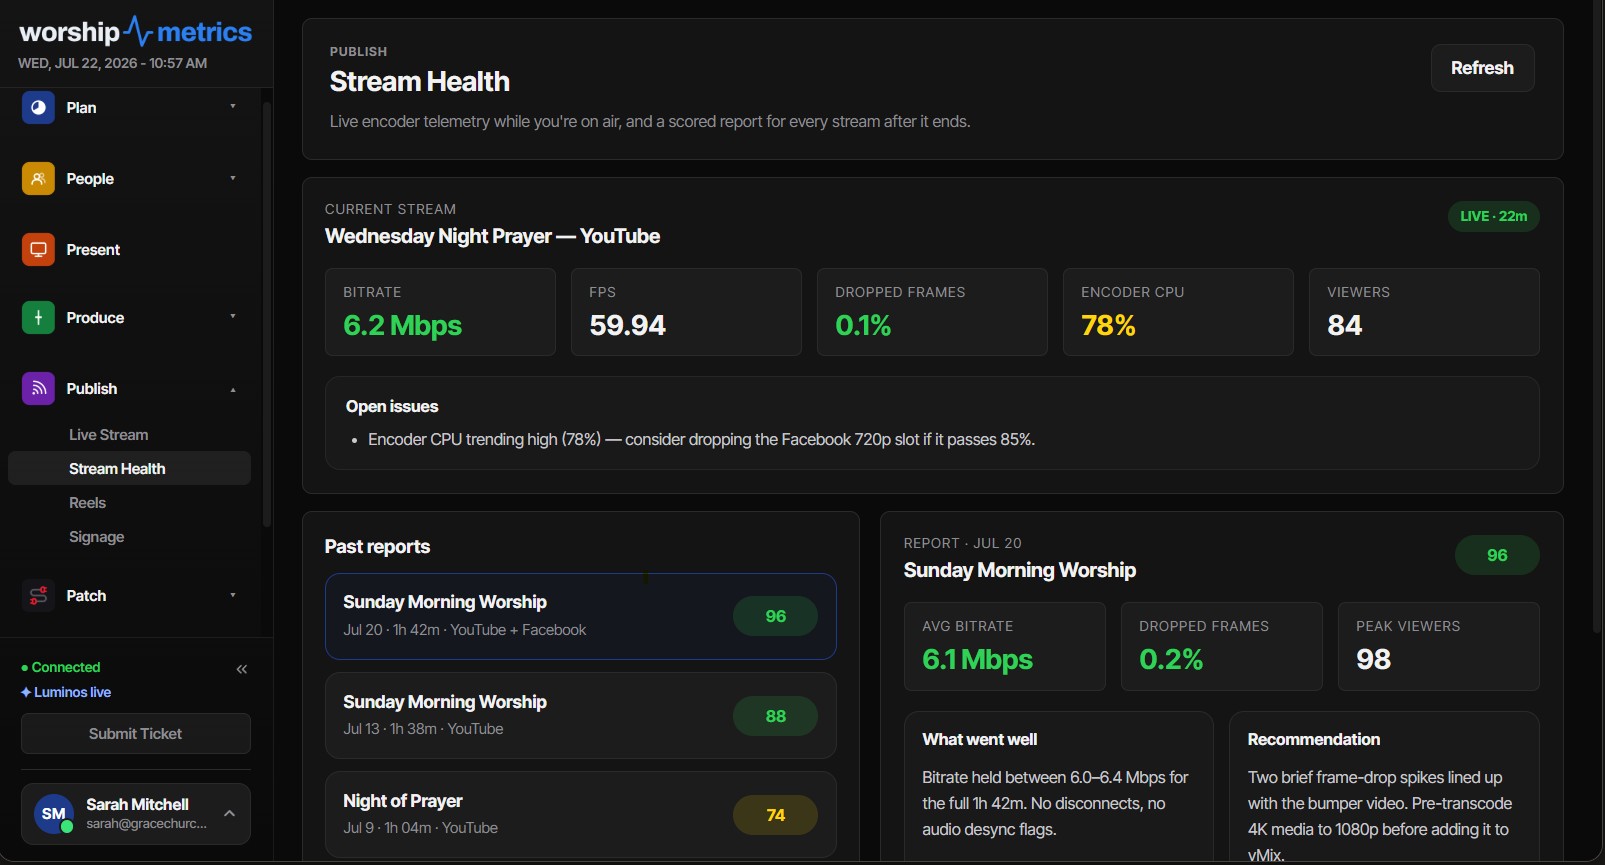
One number, one service
On Max, after every stream, WorshipMetrics gives you a single 0-100 health score for the session. It’s designed to answer the question every tech director asks on Monday morning: was Sunday actually okay, or did we just get lucky?
The score is not a grade on your team, your gear budget, or your creativity. It’s a summary of what the encoder and the booth computer were experiencing while the stream was live — and because every deduction comes with a plain-English recommendation, a low score is less a verdict and more a to-do list.
This article walks through where the number comes from, what each penalty means, and the practical fix for every common deduction.
The telemetry: seven measurements, every five seconds
While your stream runs, the WorshipMetrics Tech Manager desktop app on the booth PC samples telemetry from your encoder — vMix or OBS — every five seconds. Seven measurements make up each sample:
- Bitrate vs. target. What you asked the encoder to send versus what it’s actually pushing out. If you set a 4,500 Kbps target and the encoder is only moving 2,800, something between the booth and the internet is refusing data.
- Dropped-frame percentage. Frames the encoder gave up on sending because the network couldn’t accept them fast enough. This is the encoder’s most honest signal — it doesn’t drop frames unless it has to.
- Frames per second. Whether the encoder is actually producing video at the rate you configured. A 30 fps stream rendering at 22 fps looks like stutter to every viewer, on every platform.
- Encoder load. How hard the encoding engine itself is working. An encoder running near its ceiling has no headroom for the moment the lighting changes and every pixel in the frame suddenly needs re-encoding.
- CPU usage. The whole machine, not just the encoder — because a Windows update or a runaway browser tab steals cycles from your stream just as effectively as a heavy scene does.
- RAM usage. Memory pressure causes the slow, creeping degradation that’s hardest to spot live: things work at 9:00 and stutter by 9:40.
- Free disk space. Local recordings quietly consume gigabytes per hour. A disk that fills mid-service can take the recording — and sometimes the encoder — down with it.
Five-second resolution matters because Sunday problems are rarely constant. A bitrate that sags for ninety seconds during greeting time (when the lobby WiFi lights up) and recovers is a very different story from a bitrate that’s low all morning — and a per-service average would hide the difference entirely.
Each report also captures the stream’s settings at the time: resolution, target bitrate, encoder preset and profile, GOP size, and audio codec. That context is what makes reports comparable across weeks. If the score dropped the same Sunday the settings changed, you’ve usually found your answer already.
The 45-second reconnect grace window
Streams hiccup. A router renegotiates, an ISP path flaps for a moment, the encoder re-establishes its connection, and the service carries on. The health system holds a 45-second grace window around these events: if the stream comes back within it, the drop is counted as a reconnect inside the same session rather than the end of one stream and the start of another.
This matters for two reasons:
- One service produces one report. Without the grace window, a Sunday with two brief blips would show up in your history as three separate stream fragments, none of which tells the full story. With it, you get a single report that says: one service, two reconnects, here’s when they happened.
- Reconnects become a measurable signal. Because they’re tallied within the session, the score can penalize a pattern of them — which is exactly the kind of “it always comes back, so we never investigated” problem that eventually becomes a mid-sermon outage. If your stream does go down and stay down, that’s a different playbook — see what to do when your stream drops mid-service.
The penalties, one by one
The score starts at 100 and takes weighted deductions when the telemetry crosses defined thresholds. The weights reflect how badly each problem hurts the people watching:
| Issue | Trigger | Penalty |
|---|---|---|
| Dropped frames | ≥5% of frames dropped | −35 |
| Frequent reconnects | ≥3 reconnects per hour | −25 |
| Sustained low FPS | Frame rate held below target | −20 |
| Encoder overload | Encoding engine running beyond healthy load | −18 |
| Bitrate instability | Output bitrate wandering from target | −15 |
Every deduction ships with a specific recommendation in the report itself, but here’s the longer version of what each one means and how to fix it.
Dropped frames ≥5% (−35): the network refused data
This is the heaviest penalty because it’s the one viewers feel most directly — dropped frames arrive on the other end as freezes, pixelation, and audio that outruns the video. Five percent may sound small; spread over a 75-minute service it’s several minutes of visibly broken stream.
Dropped frames are almost always the upload path, not the encoder. The fixes, in order of likely payoff:
- Get the encoder on wired Ethernet. WiFi in a building full of phones is the single most common cause of Sunday-morning frame drops.
- Right-size the bitrate to your uplink. A safe rule of thumb is to stream at no more than half your reliably measured upload speed — measured on Sunday morning, not Tuesday afternoon.
- Separate streaming traffic from guest WiFi. A congregation’s worth of phones on the same internet connection will win the bandwidth fight. VLANs and QoS rules for the booth are covered in our church network guide for AV and streaming.
Reconnects ≥3/hour (−25): the connection keeps flapping
The grace window keeps brief drops from splitting your session, but three or more reconnects in an hour is a pattern, not bad luck. Each reconnect is a stretch of dead air for viewers and a small gamble that the stream comes back at all.
Look upstream of the encoder: a modem or router that needs a reboot (or replacement), an ISP path that degrades under neighborhood load, or building equipment that resets on a schedule. If reconnects cluster at the same time each week, that timing is your best clue. And if the building’s connection simply can’t hold steady, a bonded or cellular backup path for the booth is a far better investment than a faster plan on the same unreliable line.
Sustained low FPS (−20): the machine can’t render in real time
When the encoder can’t produce frames at the configured rate, the stream stutters even on a perfect network. Common causes and fixes:
- Scene complexity. Multiple camera inputs, NDI sources, and layered graphics all cost rendering time. Simplify the scenes you actually use live.
- Frame-rate mismatches. A 60 fps camera feeding a 30 fps output (or a mix of mismatched sources) forces constant conversion. Standardize your sources to one frame rate.
- The GPU is doing double duty. Rendering the program output and encoding on the same starved GPU is a classic booth bottleneck. The scene-building and performance chapters of our OBS Studio guide and vMix guide cover this in depth for each encoder.
Encoder overload (−18): no headroom left
Encoder load near the ceiling means the encoding engine is one busy frame away from falling behind. The fixes trade a little quality you won’t miss for stability you will:
- Use a faster preset. On x264, stepping from
mediumtoveryfastdramatically reduces load with a modest quality cost that’s rarely visible at streaming bitrates. - Move to hardware encoding. NVENC (NVIDIA), Quick Sync (Intel), or AMF (AMD) offloads encoding from the CPU almost entirely, and modern hardware encoders are excellent at church-typical bitrates.
- Downscale the output. Encoding 1080p while your cameras and bandwidth realistically support 720p buys enormous headroom — and at church-typical viewing sizes, a stable 720p consistently beats a struggling 1080p.
Bitrate instability (−15): the output wanders from target
A bitrate that oscillates — hitting target, sagging, spiking back — produces buffering for viewers even when the average looks fine, because streaming platforms build their quality ladders assuming steady input.
- Confirm the encoder is set to CBR (constant bitrate) for the streaming output. Variable bitrate is great for recordings and rough on live delivery.
- Check what shares the line. Cloud backups, sync clients, and building systems that phone home mid-morning all cause the sag-and-recover signature.
- Watch the correlation with dropped frames. Instability plus drops is a network story; instability with clean frames is usually an encoder-settings story. The five-second samples let you tell them apart.
Reading scores over time
A single number is a snapshot; the trend is the diagnosis. A practical way to read your history:
- A consistently high score means your settings, machine, and network are matched to each other. Note the captured settings in those reports — that’s your known-good baseline.
- One bad Sunday is an event. Open that report, look at when the penalties triggered, and match the timestamps against what was happening in the room.
- A slow slide over weeks is drift — a machine accumulating background software, a disk filling up, a network getting busier. This is the pattern human memory misses and telemetry catches.
Because every report stores the settings it ran with, “what changed?” stops being a debate and becomes a lookup. That also makes the score a genuinely useful training tool: a volunteer who can read the report can learn what healthy looks like long before they can diagnose a problem from scratch.
How WorshipMetrics handles this
On Max, stream health scoring is built into the WorshipMetrics Tech Manager desktop app: it samples vMix or OBS every five seconds during every stream, applies the 45-second reconnect grace so each service produces exactly one report, and uploads the scored session — telemetry, penalties, plain-English recommendations, and the full settings capture — to the cloud, where it sits alongside the rest of your AV monitoring history. Paired with WorshipMetrics live streaming, the same platform carrying your stream is the one watching its health — so Monday’s question, was Sunday actually okay?, always has an answer with numbers behind it.
When Does WorshipMetrics Alert You? The Exact Thresholds
NextSRT vs RTMPS for Church Streaming: Which Ingest Protocol and How to Set It Up
Related Articles
Bitfocus Companion + ATEM Mini: A Stream Deck Panel for Your Church Switcher
A Stream Deck running Bitfocus Companion turns a Blackmagic ATEM into plain-word buttons with colors that show what's live, and the same panel can run PTZ cameras, projectors, and more. Here's how to connect Companion to an ATEM and build a volunteer page.
Lyrics Over the Camera on an ATEM Mini: Luma Keys, Chroma Keys, and the Slides Computer
To put song lyrics over the camera shot on a Blackmagic ATEM Mini, feed the slides computer into an ATEM input and key it over the camera. Here's how luma and chroma keys work for lyrics, how to design slides that key cleanly, and who should run it.
ATEM Mini + OBS for Church: Hardware Camera Switching with OBS for Graphics and Streaming
Many churches use an ATEM Mini as a camera switcher and send its output into OBS over USB as a webcam. The ATEM gives volunteers real buttons; OBS adds lyrics, graphics, recording, and streaming. Here's how to set it up, split the jobs, and avoid the common sync and quality problems.