Every clip is a small signal
Most pastors finish a sermon with a feeling: that landed, or I lost them halfway. It’s a real instinct, but it’s hard to test. The livestream replay count doesn’t help much; it tells you how many people pressed play on the whole service, not which part mattered.
Clips change that. When a sermon becomes five or six short moments, each clip is a small signal: people watched it or scrolled past, finished it or left, shared it or didn’t. Over weeks and months, those signals add up to something pastors have rarely had: a picture of what’s actually connecting.
What clip metrics can tell you
Which moments land. The clip people finish and share is usually the moment that hit home in the room too. Now you can see it.
Which topics people are hungry for. If clips about anxiety, forgiveness, or parenting consistently outperform others, that tells you something about what your community is carrying.
Which illustrations work. Stories, personal moments, and clear analogies often travel further than abstract points. Clips show you which ones.
Who’s listening. Your congregation and the wider public may respond to different things. Seeing both helps you serve both.
The numbers that matter
| Metric | What it tells you |
|---|---|
| Playbacks | How many times the clip was watched; reach |
| Completion | Whether people watched to the end; how well it held attention |
| Shares | Whether someone thought a friend needed to hear it; the strongest signal |
| Saves | Whether people wanted to come back to it |
| Comments | What people are thinking and asking |
Raw views matter least on their own. They mostly reflect how the platform chose to distribute the clip. (See how social media algorithms work.)
Your congregation and the public, side by side
Not every audience is the same. Your own members may return to different moments than strangers scrolling on YouTube.
In WorshipMetrics, you can split clip metrics between your private WorshipMetrics congregation and public numbers from YouTube. That lets you see two different questions:
- What’s feeding our people? Which moments do our own members watch and come back to?
- What’s reaching our community? Which moments travel to people who don’t know us yet?
Both matter, and they often point in different directions.
Reading the patterns
A single clip’s numbers don’t mean much. Patterns do. Once a month, look across all of the month’s clips and ask:
- Which three clips did people finish and share most? What do they have in common?
- Which topics showed up again and again?
- Did our congregation and the public respond to different things?
- What questions came up in comments? Could a future sermon or small group address them?
(See the monthly media insights review for leadership for a full meeting agenda.)
Let numbers inform, not dictate
There’s a real risk here, and it’s worth naming: metrics can tempt a church to preach for clicks. That’s not what they’re for.
Scripture, prayer, and the pastor’s calling shape the message. Insights can help a pastor communicate it better: which illustrations land, which questions people are asking, which moments to share more widely. A hard but necessary sermon that gets fewer clicks is still the right sermon. Measurement should support discernment, not replace it. (See the six-metric weekly report.)
How WorshipMetrics organizes it
Reels (formerly Worship Clips) turns each service into clips: it connects to your YouTube livestream, suggests the strongest moments, and renders captioned, branded clips in vertical, square, and horizontal, in the language your pastor preached. As those clips are watched, WorshipMetrics brings the numbers together so pastors and leadership can see which sermons and moments resonate, alongside in-person and online attendance in Service Metrics.
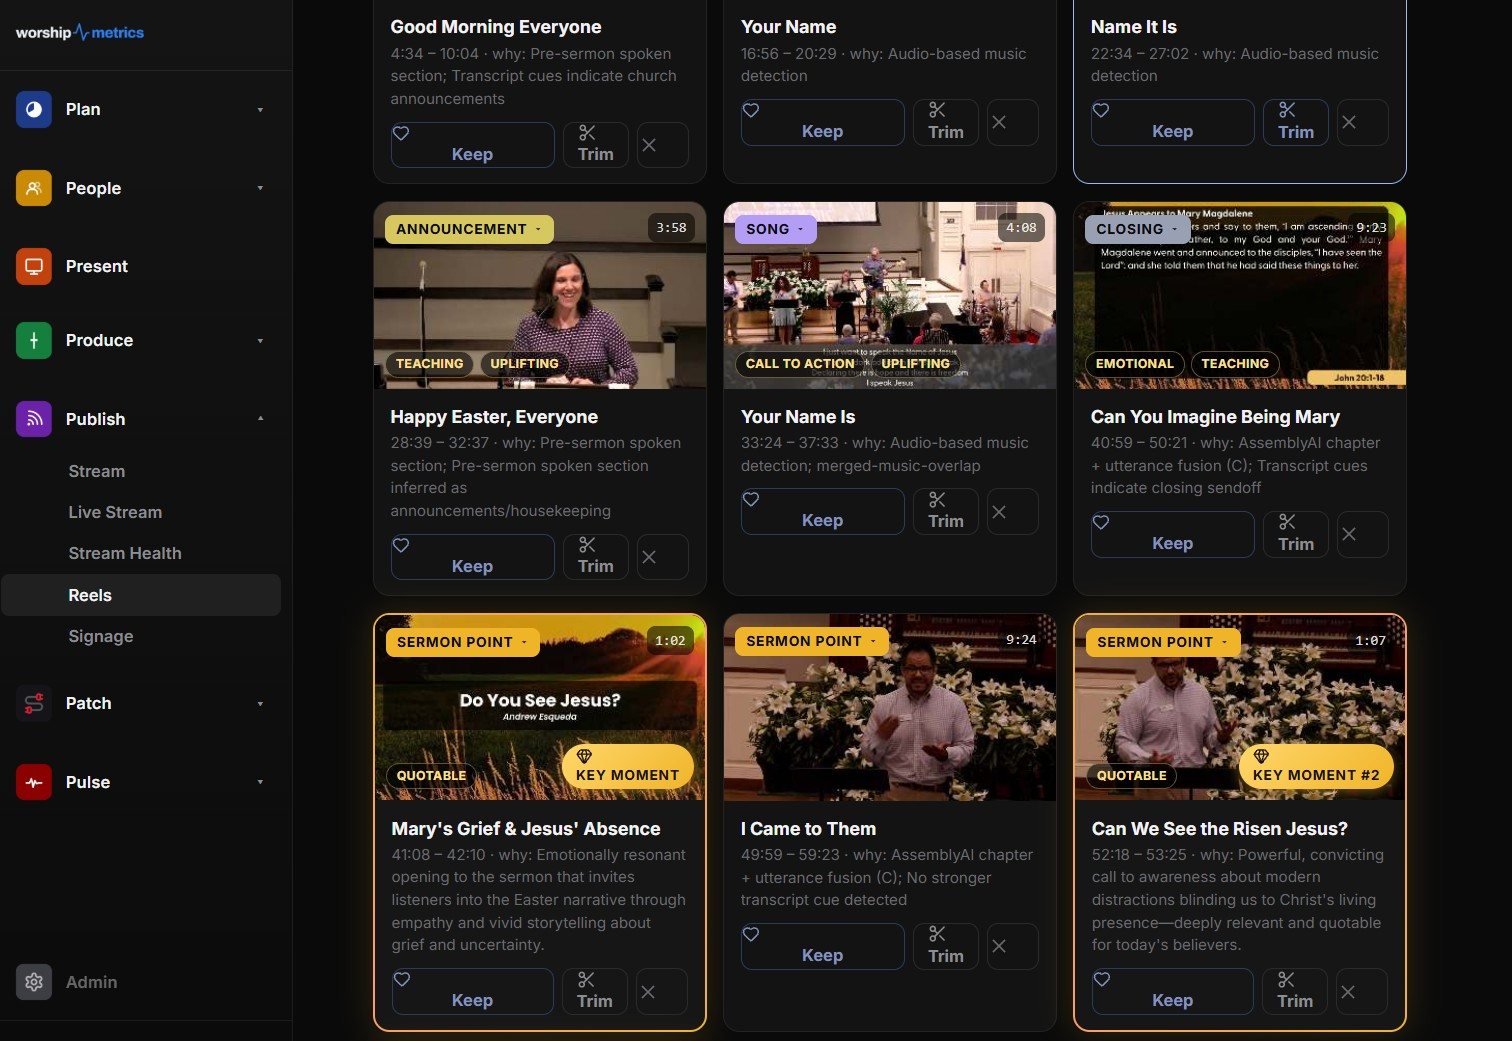
Reels is free and unlimited in Tech Manager on your church’s computer, and cloud Reels comes with the Pro and Max plans.
Related questions
- How can a pastor tell which sermons resonate?
- Clip each sermon into short moments and watch how people respond: playbacks, how many finish, shares, saves, and comments. Over a few months, patterns appear: topics, illustrations, and moments that consistently connect.
- What sermon clip metrics matter most?
- Completion (did people watch to the end), shares and saves (did it matter enough to pass on or keep), and comments. Raw views matter less, because they mostly reflect how the platform distributed the clip.
- Should metrics change what a pastor preaches?
- Metrics should inform, not dictate. They can show which illustrations land and which questions people are asking, but the message is shaped by scripture and the pastor's calling. Use insights to communicate better, not to chase popularity.
The Monthly Media Insights Review for Church Leadership
NextWhich Worship Songs Does Your Congregation Love? Song Insights From Clips
Related Articles
A Content Engine That Stays Personal: More Clips, Better Titles, Better Thumbnails
Keeping up online means more content than most church teams can make by hand. Clipping every service, with AI help on titles, descriptions, and thumbnails, turns one sermon into a week of posts. Here's how to build a church content engine that stays personal, controllable, and true to your voice.
Which Worship Songs Does Your Congregation Love? Song Insights From Clips
Worship leaders usually choose songs by feel, familiarity, and theme. Clip metrics add another view: which songs people play again and again, at church and online. Here's how to read worship song insights to plan stronger sets, and the licensing to check along the way.
Bilingual Church? How to Share Sermon Clips in Two Languages
If your church preaches in two languages, or holds separate services for each, your social media has to serve both. Here's how bilingual and multilingual churches can plan sermon clips: one account or two, captions, interpreted services, and reaching both generations.