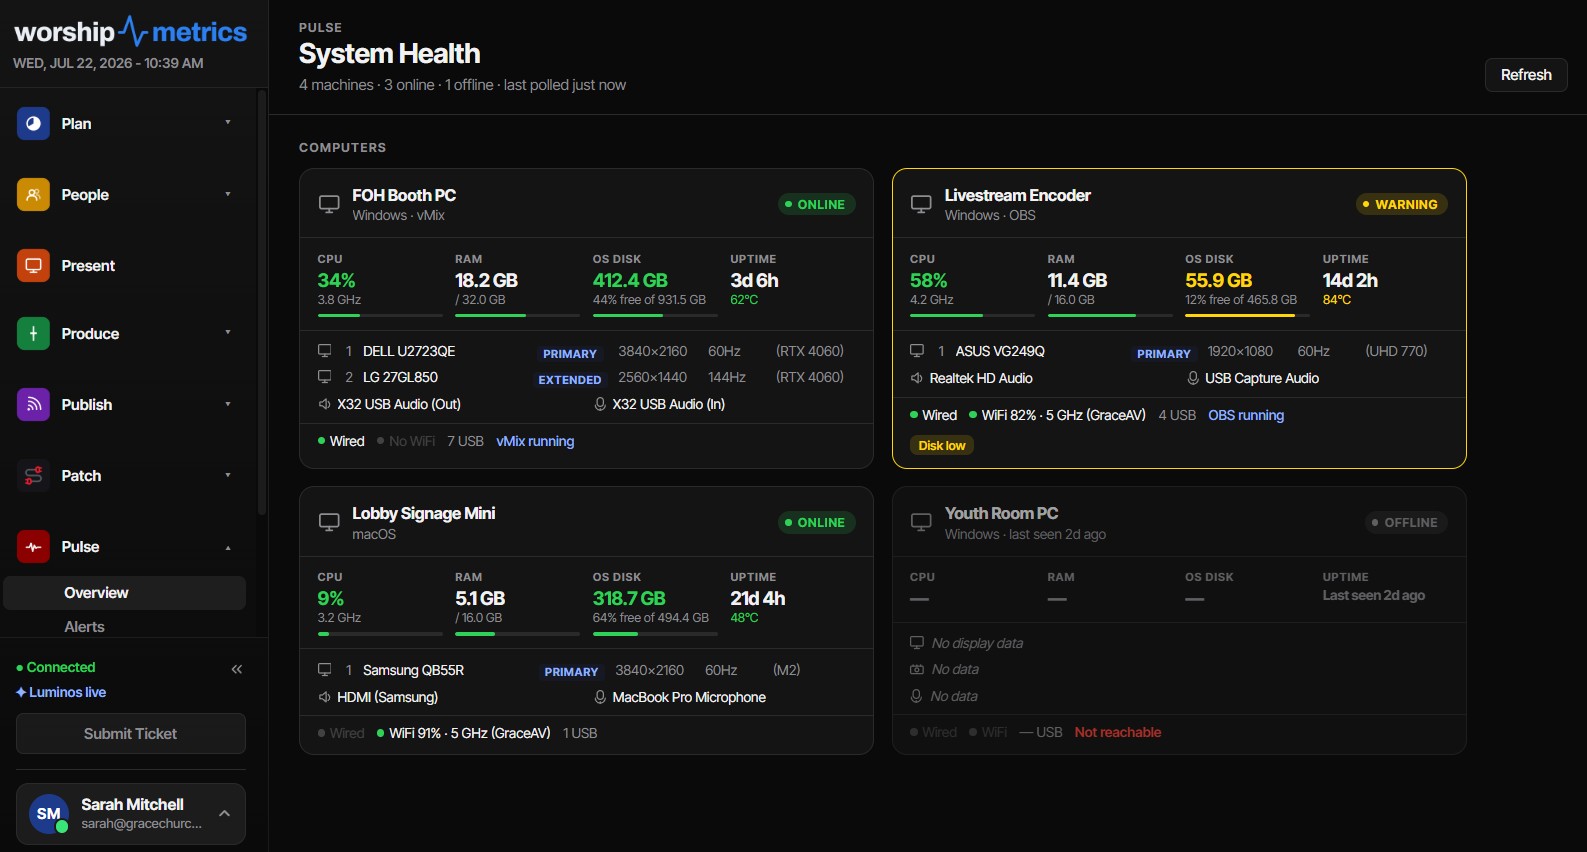
Why we’re showing you the payload
Any software that sits in your booth and phones home deserves one blunt question from your tech team: what exactly are you sending? It’s a fair question. Church AV computers live close to sensitive things — sermon recordings, congregational media, the network everything else runs on — and “trust us, it’s just telemetry” is not an answer a careful tech director should accept from anyone.
So this article is the answer in full. It’s a field-by-field tour of what the Tech Manager desktop app transmits from your booth to the cloud, on what schedule, over what kind of connection, and — just as important — what never leaves the room. If you’ve ever wanted to explain to a board member or a security-minded volunteer exactly what this thing on the production PC is doing, this is the page to send them.
The short version: Tech Manager’s telemetry is measurements and inventory, not your recordings. Almost everything in the payloads below is a number, a name, or a status. The one exception is pictures of your switcher: on an OBS booth the heartbeat uploads a still thumbnail of each scene that changed, and a vMix booth sends input snapshots while someone has the web Switcher open. No audio, no recordings, no keystrokes.
Two beats, two jobs
Tech Manager sends telemetry on layered cadences, each sized for its job. The two main beats:
| Beat | Interval | Contents | Purpose |
|---|---|---|---|
| Light beat | Every 15 seconds | CPU load, RAM, CPU temperature, uptime | Keeps the online badge honest, seconds-fresh |
| Full heartbeat | Every 60 seconds | Complete hardware snapshot + AV device probe results + stream telemetry | The deep picture behind the Pulse dashboards |
Between them, a 30-second health snapshot reports the streaming app’s state, the network, and system resources, and problems like a dropped stream are reported the moment they happen.
The light beat travels over a persistent WebSocket the booth holds open to the cloud, with an HTTPS fallback (at a gentler ~45-second cadence) if something on your network blocks the socket. It’s deliberately tiny — four vital signs — because its only job is answering “is this machine alive and breathing?” The shared online threshold is 90 seconds, which means a machine that goes quiet for 90 seconds flips to offline in the fleet view. The server and the dashboard read the same constant, so they can never disagree about who’s up.
The full heartbeat is where the substance rides. Once a minute, the booth packages everything below and sends it up. What happens to that data on the other side — the thresholds, the alerts, the emails and texts — is covered in the Pulse alert thresholds reference; this article stays on the sending side.
The hardware snapshot, field by field
The 60-second heartbeat carries a full machine snapshot. Here is everything in it:
Processor. Overall CPU load, per-core load, current clock speeds, CPU temperature, and the processor brand string. Temperature matters more than most teams expect — a booth PC in a sealed cabinet announces its failing fan weeks in advance through this one number.
Memory. Total and used RAM.
Storage. Every disk individually, with the drive model and whether it’s NVMe or SATA SSD, plus free space per volume. This is what powers early warnings before a recording drive fills mid-service.
GPU. Model, VRAM size, and the installed driver version and date. (Note what’s not here: Tech Manager doesn’t report GPU utilization percentages — it tracks what hardware you have and whether the driver is current, which is what actually matters for troubleshooting.)
Displays. Every connected display with resolution, refresh rate, HDR state, bit depth, color space, rotation, DPI scale, and connection type (HDMI or DisplayPort). If someone bumps a projector feed from 60 Hz to 30 Hz on Wednesday, this is how you find out before Sunday.
Audio endpoints. Every input and output device the OS sees, with live volume level, mute state, and sample rate. This is what enables the pre-service “your main output is muted” warning (on Windows). The booth also enumerates installed ASIO drivers from the Windows registry — which is how a Dante Virtual Soundcard shows up even though it’s invisible to normal endpoint enumeration — and discovers physical Dante hardware on the network via mDNS.
Network. All network adapters, including unplugged NICs with their MAC addresses (useful when documenting which port goes where), and for WiFi: the SSID, signal strength in dBm, and band. If a booth machine that should be on wired Ethernet quietly fails over to the guest WiFi, the heartbeat tells on it — and our guide to church network design for AV covers why that distinction matters so much.
System. OS version and build, plus uptime.
USB and software inventory
Two inventory layers ride along with the telemetry, and both are built to be stable rather than chatty.
USB devices aren’t polled on a timer — Tech Manager subscribes to Windows Plug-and-Play device creation and deletion events and identifies each device by its stable PnP device ID. That design choice matters: polling-based USB monitoring is notorious for “phantom flaps,” where a device appears to disconnect and reconnect because a poll caught it mid-enumeration. Event-driven tracking with stable IDs means when your timeline says the presentation clicker receiver disconnected at 9:47, it actually did. Every plug and unplug lands in the machine’s event log with a timestamp.
Software inventory is collected hourly from the Windows uninstall registry — the same list you’d see in Settings, captured programmatically. Driver inventory is collected the same way (Windows only), and a daily cloud-side job checks NVIDIA’s latest published driver so the fleet view can show “update available” without you visiting a vendor site. The practical payoff: when a volunteer installs something on the booth PC, or an encoder silently updates itself the week before a problem starts, the install shows up in the timeline right next to the symptoms. It turns “what changed?” from an interrogation into a lookup.
Stream and AV device telemetry
When a stream is running, the heartbeat carries the encoder’s vitals: bitrate versus target (kbps), dropped-frames percentage, encoder load percentage, frames per second, the current scene, output resolution, the destination, and reconnect attempts. Alongside those ride network measurements — upload and download throughput, latency, jitter, and packet-loss percentage — plus audio silence and clipping flags. These are the raw inputs behind the after-service composite number explained in reading your stream health score, and they’re what let a drop alert go out while you can still do something about it.
Monitored AV gear — cameras, consoles, switchers, anything you’ve flagged for watching — is probed on its own rhythm: health sweeps every 20 to 60 seconds. Here the design goal is efficiency without staleness. Each sweep result is hashed on its salient fields, and results are only transmitted when something actually changed, with a forced keepalive every 5 minutes so silence is never ambiguous. On the cloud side, an observer that goes quiet for 10 minutes is demoted to an honest “stale” state rather than a frozen “online.” Your network never carries redundant traffic, and the dashboard never shows you a fossil.
What stays local
Just as important as what’s sent is what isn’t. Several of Tech Manager’s most bandwidth-hungry functions are deliberately local-only:
- Recordings never leave through telemetry. The heartbeat schema contains measurements, names, and states, plus the switcher thumbnails described above — there is no field anywhere in it for video, program audio, or recordings.
- Audio metering stays in the room. The high-rate meter data driving the local mixer view (roughly 30 updates per second from the switcher) never crosses the internet; remote views receive small snapshots at a much lower rate instead.
- The volunteer remote talks only to the booth. When a volunteer drives the service from a phone, the phone reaches the booth over your local network with a per-session token and never talks to the cloud itself. (The booth passes each press on to the cloud, so the booth still needs its internet connection.)
- Clip processing can run on the booth machine. Reels can transcribe and render locally, so sermon video is processed without uploading the source video. The transcript’s text goes to the cloud for the AI’s picks, and a finished clip goes up only when you post it.
And on the cloud side, retention is bounded, not indefinite: raw telemetry observations are kept 7 days, AV device metrics 30 days, hardware and device health events 60 days, and alert history 90 days.
The connection model: outbound only
The last piece of the trust picture is how all this travels.
Tech Manager makes outbound connections only — a persistent encrypted WebSocket (WSS) to the cloud, kept alive with a ping every 25 seconds, plus a provisioning pull every 5 minutes. You never open an inbound port, never configure port forwarding, never touch NAT. From your firewall’s point of view, the booth PC behaves like a web browser.
Remote control works over that same outbound socket, with several deliberate constraints. A machine binds to exactly one organization at pairing time, using a one-time admin-issued code that expires after 30 minutes. Every command from the web travels through authenticated, organization-checked routes, and the booth only honors actions on an explicit allowlist — there is no general “run anything” channel. Commands carry a 30-second correlation timeout, and if the booth is offline, the request fails immediately and honestly rather than queueing silently. Every remote action lands in the same per-machine timeline as the hardware events, so the audit trail is complete — the same visibility philosophy behind how Tech Manager’s self-healing shows its work.
That’s the whole payload, end to end. No mystery fields, no media, no listening ports. If your team ever wants to verify any of it, the per-machine telemetry pages show you exactly what your own booth reported, beat by beat.
How WorshipMetrics handles this
Everything in this tour is the day-to-day work of Tech Manager, the WorshipMetrics booth application for Windows and Mac. It sits in the system tray with a health-dot badge, sends its 15-second light beats and 60-second snapshots automatically, and needs no firewall changes to do it. The receiving end is AV monitoring with Pulse, where those payloads become the live machine grid, the alert feed, per-machine timelines, and the stream-health view your whole team — including the pastor with a phone — can read at a glance. If something in your telemetry ever looks wrong, that same data is already on screen when you reach a human through phone support, so the conversation starts at the diagnosis, not the archaeology.
Team Chat File Sharing: Formats, Limits, and Why Your Files Stay Private
NextThe Volunteer Scheduling Email Lifecycle: Invites, Declines, and Reminders
Related Articles
Church AV Upgrade: What to Keep and What to Replace
A church AV upgrade almost never means starting over. Here's the decision table churches use to keep the cameras and the sound board, replace the computer and the cables, and quote only what's missing.
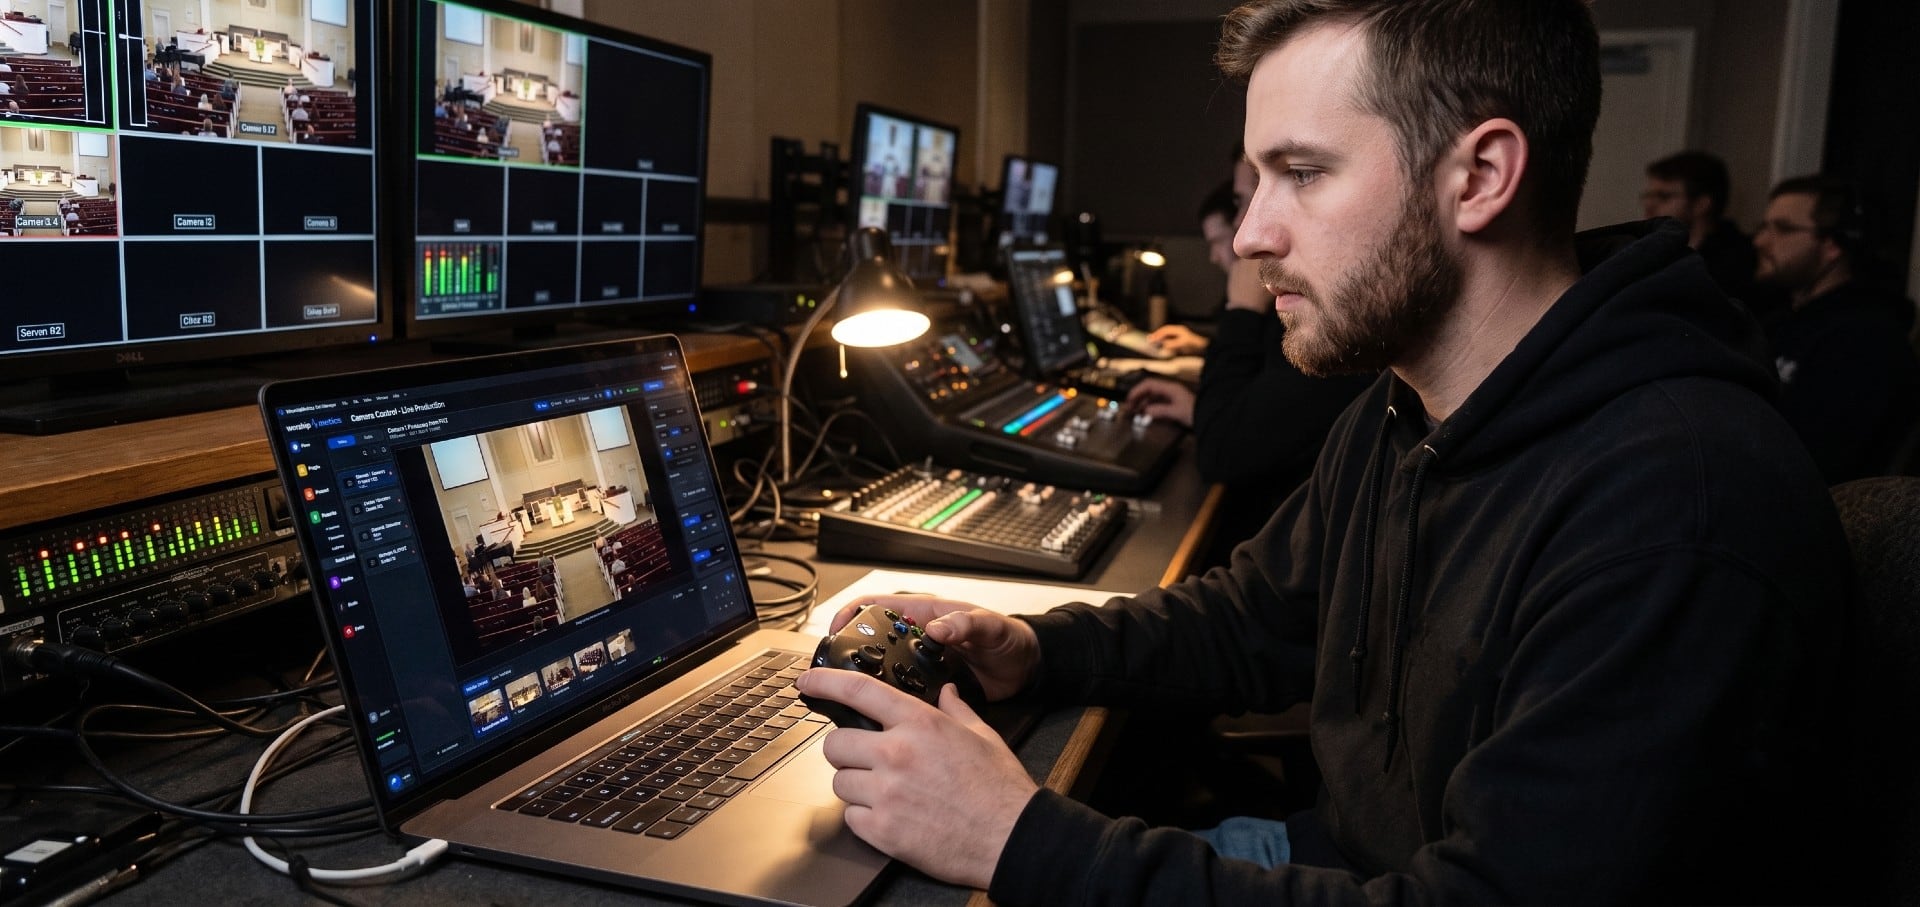
How to Control PTZ Cameras with an Xbox Controller
Drive your church's PTZ cameras with an Xbox controller: analog pan and tilt, zoom on the triggers, focus on the bumpers and presets on A, B, X and Y. What you need, setup step by step, the button map, and fixes when the controller doesn't respond.
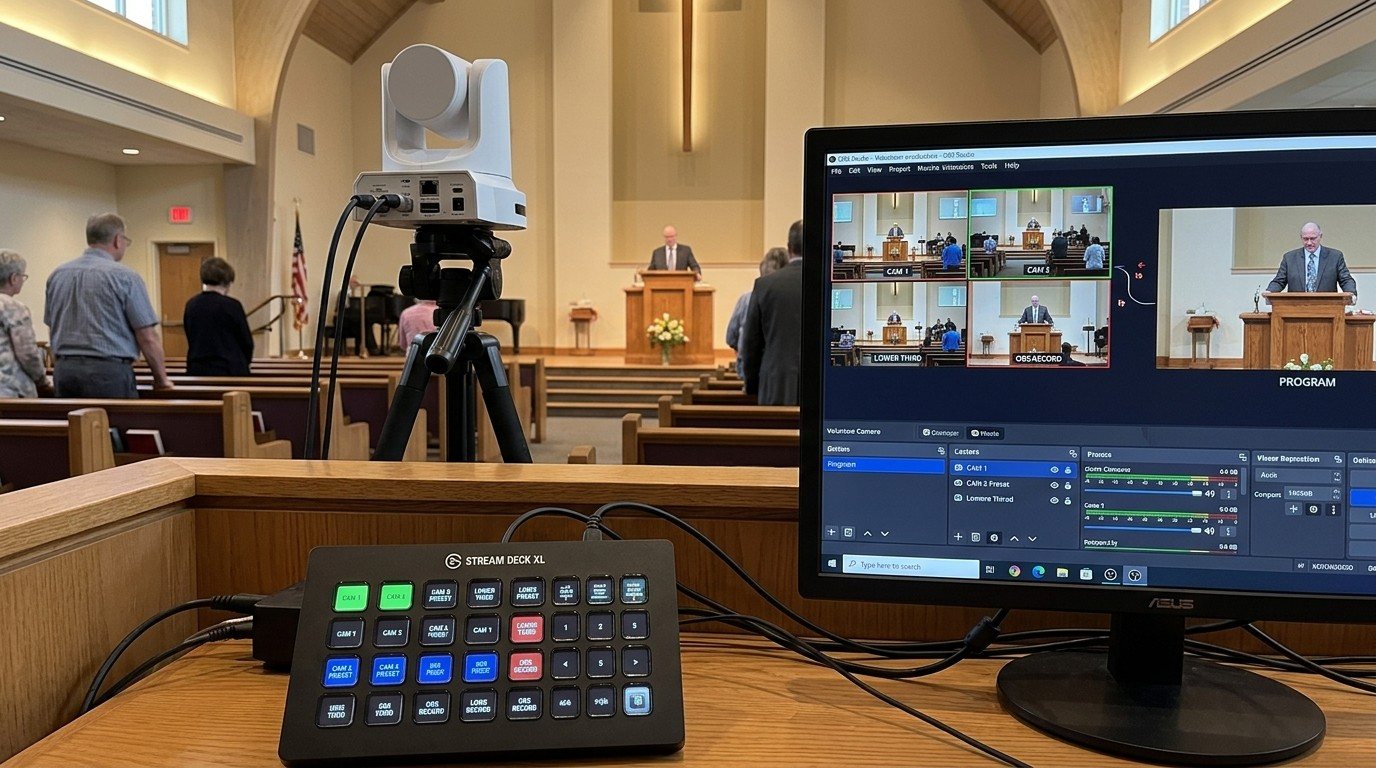
Controlling Projectors, PTZ Cameras, and Sound Boards with Bitfocus Companion
Bitfocus Companion can control far more than OBS and vMix. Projectors over PJLink, PTZ cameras over VISCA, digital sound boards over the network, and almost anything else with an IP address. Here's how churches connect the rest of the room, and how to plan a 'Start Service' button that does it all.